BALANCE OF MERCHANDISE TRADE
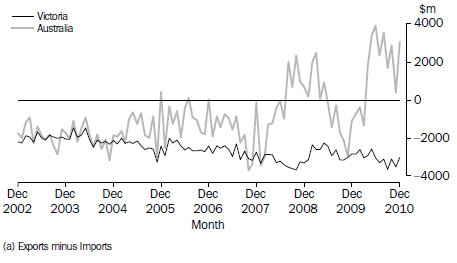
Statistics are collected for imports and exports. In this chapter, imports are presented in terms of Customs Value, while exports are presented in terms of Free on Board Value. In December 2010, the balance of international merchandise trade (i.e. the value of exports less the value of imports) for Victoria was a deficit of $3,000m. The value of the state's merchandise exports was $1,754m, while merchandise imports totalled $4,755m. Compared with December 2009, Victoria's trade deficit in December 2010 was $168m (5.9%) higher, with a rise in the value of exports (up $127m, or 7.8%) being offset by a $296m rise in the value of imports (6.6%). Victoria recorded an average monthly trade deficit of $3,055m for the 12 months ending December 2010.
At the national level, the value of imports was 2.9% higher in December 2010 compared with December 2009, while the value of exports (including re-exports) was 28.4% higher over the same period.
Balance of international merchandise trade(a)

In 2009-10, Victoria's trade deficit was $34,691m, a decrease of $1,392m (3.9%) over the previous financial year. The state's exports and imports decreased by $1,948m (9.6%) and $3,340m (5.9%) respectively.
More detailed animated trade pyramids for Victoria are available in
https://www.abs.gov.au/websitedbs/D3310114.nsf/home/Victorian+Trade+Pyramid. These pyramids illustrate the change over time (from 1988–89 to 2008–09) in Victoria's exports and imports among the state's top ten (in dollar terms) trading partners by broadly grouped commodities.
View underlying table as an Excel spreadsheet: Download Balance of international merchandise trade from the
Downloads Page.
 Print Page
 Print All