RECURRENT EXPENDITURE
In 2010-11 the estimate of expenditure funded by state and territory government on recurrent cultural activities was 83% of total expenditure, which is similar to the estimates in 2009-10 (82%) and 2008-09 (84%). (Tables 3 and 4)
Across all state and territory governments, the proportion of recurrent expenditure ranged from 78% of total expenditure by the Western Australian Government to 95% by the Tasmanian Government.
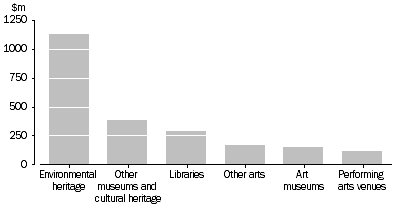
Of all recurrent expenditure, 44% was for the Environmental heritage category. This was followed by Other museums and cultural heritage (15%), Libraries (11%), Other arts (7%) and Art museums (6%).
STATE AND TERRITORY GOVERNMENT RECURRENT CULTURAL EXPENDITURE, By selected categories
- 2010-11

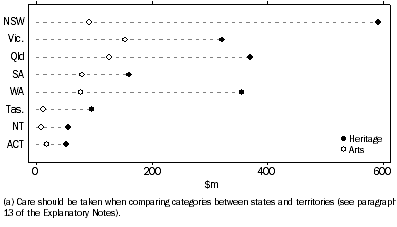
Of all the state and territory governments, the New South Wales Government had the highest estimate for recurrent expenditure on Heritage activities ($591.8m) and the Victorian Government had the highest estimate for recurrent expenditure on Arts activities ($154.0m).
STATE AND TERRITORY GOVERNMENT RECURRENT CULTURAL EXPENDITURE(a), Heritage and Arts
- 2010-11

 Quality Declaration
  Print Page
 Print All