APPENDIX 3: CALCULATION OF UNDERLYING TREND INFLATION MEASURES USING PUBLISHED CPI DATA
This appendix gives a more detailed explanation of the calculation of the Trimmed mean and Weighted median underlying trend inflation measures. For more information regarding the calculation of these please contact the CPI Director on 02 6252 7326.
This example outlines the steps to calculate the underlying trend inflation measures for the June quarter 2011 from publically available CPI data. Please note there may be small differences in the example shown here compared with the final numbers published due to ABS rounding procedures. The ABS calculations of the Trimmed mean and Weighted median index numbers are derived from the relevant components that are unrounded until the final stage. The final percentage changes (also rounded to one decimal place) are calculated from the rounded index numbers. In the example below, some rounding is shown in earlier stages to illustrate the calculation process.
Weighted median
1. The seasonally adjusted June quarter 2011 percentage change from previous quarter is calculated for all expenditure classes at the weighted average of eight capital cities level. (Note: For the expenditure classes not identified as seasonal, their seasonally adjusted percentage change from previous quarter is calculated using a seasonal adjustment factor of 1).
2. All expenditure classes are ranked from lowest to highest according to the seasonally adjusted percentage change from previous quarter movement calculated in step 1. See Table 4, column 2.
3. The relative weight of each expenditure class in the previous quarter is calculated on a seasonally adjusted basis. For example, the relative weight of each expenditure class in June quarter 2011, seasonally adjusted, is calculated using the March quarter 2011 points contribution to the All groups CPI and the March quarter 2011 seasonal factors calculated in June quarter 2011.
4. The relative weight of the expenditure class is assigned according to the ranking calculated in step 2.
5. Using the relative weight distribution calculated in step 4, a distribution of cumulative weights by expenditure class is calculated. See Table 4, column 3.
6. The Weighted median is the seasonally adjusted quarterly percentage change of the expenditure class at the 50th percentile (or immediately over).
7. In this example, the June quarter 2011 Weighted median is ‘Fish and other seafood’ with a (rounded) movement of 0.6%. See table Table 4, footnote (a).
Trimmed mean
8. To calculate the Trimmed mean, the expenditure classes with a cumulative total below 15% and above 85% are removed (trimmed). See Table 4 column 3 and footnotes (b) and (e).
9. Expenditure classes which cross the 15% and 85% threshold have the component of their weight inside the 70% trim included. See table 4, footnotes (c) and (d).The results of steps 8 and 9 are shown in Table 5. It can be seen in Table 5, that the trimmed relative weights in column 3 total 70%.
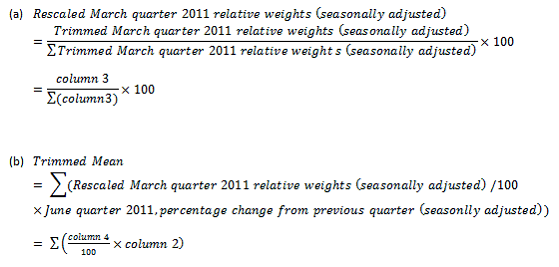
10. As some of the expenditure classes have been trimmed from the original distribution, the expenditure classes relative weights are rescaled to total to 100%. See Table 5, column 4 and formula (a).
11. The Trimmed mean is calculated as the sum of the rescaled March quarter 2011 relative weights (seasonally adjusted) multiplied by the percentage change from previous quarter (seasonally adjusted), all divided by 100. See formula (b).
12. In this example, the June quarter 2011 Trimmed mean is 0.7%.
Table 4: Expenditure classes ranked from lowest to highest by percentage change from previous quarter, June quarter 2011
Expenditure class, ranked from lowest to highest
(1) | June quarter 2011, percentage change from previous quarter (seasonally adjusted)
(2) | March quarter 2010, cumulative weights % (seasonally adjusted)
(3) |
 | | |
| Vegetables (b) | -10.3 | 1.50 |
| Audio, visual and computing equipment (b) | -6.3 | 2.07 |
| Tea, coffee and food drinks (b) | -4.9 | 2.31 |
| Milk (b) | -3.6 | 2.83 |
| Fats and oils (b) | -3.0 | 3.03 |
| Toiletries and personal care products (b) | -2.7 | 4.04 |
| Other household supplies (b) | -1.9 | 5.38 |
| Ice cream and other dairy products (b) | -1.7 | 5.70 |
| Sports and recreational equipment (b) | -1.3 | 6.13 |
| Small electric household appliances (b) | -1.1 | 6.36 |
| Pork (b) | -1.0 | 6.52 |
| Women's footwear (b) | -0.9 | 6.79 |
| Men's outerwear (b) | -0.9 | 7.29 |
| Motor vehicle repair and servicing (b) | -0.9 | 9.20 |
| Toys, games and hobbies (b) | -0.7 | 9.61 |
| Women's underwear, nightwear and hosiery (b) | -0.7 | 9.86 |
| Bread (b) | -0.6 | 10.58 |
| Food n.e.c. (b) | -0.6 | 11.12 |
| Wine (b) | -0.6 | 12.51 |
| Automotive fuel (c) | -0.5 | 16.71 |
| Eggs | -0.3 | 16.80 |
| Motor vehicle parts and accessories | -0.2 | 17.51 |
| Motor vehicles | -0.2 | 21.47 |
| Children and infants' clothing | -0.2 | 21.78 |
| Soft drinks, waters and juices | 0.0 | 22.77 |
| Floor and window coverings | 0.0 | 23.48 |
| Audio, visual and computing media and services | 0.0 | 24.65 |
| Overseas holiday travel and accommodation | 0.1 | 26.34 |
| Tools | 0.2 | 26.65 |
| Books | 0.2 | 27.04 |
| Food additives and condiments | 0.3 | 27.32 |
| Newspapers and magazines | 0.3 | 27.71 |
| Beef and veal | 0.3 | 28.14 |
| Spirits | 0.3 | 29.14 |
| Pharmaceuticals | 0.4 | 30.16 |
| Tobacco | 0.4 | 33.33 |
| Telecommunication | 0.4 | 36.04 |
| Beer | 0.4 | 38.12 |
| Optical services | 0.4 | 38.22 |
| Women's outerwear | 0.4 | 39.07 |
| Glassware, tableware and household utensils | 0.4 | 39.45 |
| Household cleaning agents | 0.4 | 39.74 |
| House purchase | 0.5 | 47.70 |
| House repairs and maintenance | 0.5 | 49.85 |
| Fish and other seafood (a) | 0.6 | 50.28 |
| Dental services | 0.6 | 51.00 |
| Sports participation | 0.6 | 51.77 |
| Other motoring charges | 0.6 | 52.92 |
| Tertiary education | 0.8 | 54.23 |
| Clothing services and shoe repair | 0.8 | 54.39 |
| Take away and fast foods | 0.8 | 57.11 |
| Other financial services | 0.9 | 60.29 |
| Men's underwear, nightwear and socks | 1.0 | 60.39 |
| Major household appliances | 1.0 | 60.90 |
| Cakes and biscuits | 1.0 | 61.66 |
| Hairdressing and personal care services | 1.0 | 62.42 |
| Rents | 1.0 | 68.32 |
| Hospital and medical services | 1.1 | 71.51 |
| Poultry | 1.1 | 71.94 |
| Other recreational activities | 1.1 | 73.14 |
| Other household services | 1.2 | 73.80 |
| Gas and other household fuels | 1.2 | 74.64 |
| Restaurant meals | 1.3 | 76.67 |
| Snacks and confectionery | 1.3 | 77.76 |
| Preschool primary education | 1.4 | 78.35 |
| Cheese | 1.4 | 78.71 |
| Property rates and charges | 1.4 | 80.06 |
| Other cereal products | 1.5 | 80.25 |
| Secondary education | 1.5 | 81.40 |
| Breakfast cereals | 1.6 | 81.58 |
| Child care | 1.7 | 81.89 |
| Electricity | 1.7 | 84.16 |
| Pet services including veterinary | 1.8 | 84.62 |
| Jams, honey and sandwich spreads | 1.8 | 84.77 |
| Domestic holiday travel and accommodation (d) | 1.9 | 86.94 |
| Urban transport fares (e) | 1.9 | 87.68 |
| Bacon and ham (e) | 2.0 | 87.90 |
| Pets, pet food and supplies (e) | 2.0 | 88.37 |
| Lamb and mutton (e) | 2.0 | 88.67 |
| Deposit and loan facilities (e) | 2.1 | 92.67 |
| Postal (e) | 2.1 | 92.78 |
| Insurance services (e) | 2.2 | 94.48 |
| Towels and linen (e) | 2.5 | 94.76 |
| Men's footwear (e) | 2.5 | 94.89 |
| Other fresh and processed meat (e) | 2.7 | 95.29 |
| Furniture (e) | 3.0 | 96.96 |
| Water and sewerage (e) | 3.0 | 98.09 |
| Accessories (e) | 4.8 | 98.62 |
| Children's footwear (e) | 8.2 | 98.72 |
| Fruit (e) | 33.8 | 100.00 |
|
Note:
(a) Weighted median.
(b) Trimmed out - cumulative weight below 15%.
(c) Partially trimmed out. Included weight = 16.71% - 15% = 1.71%.
(d) Partially trimmed out. Included weight = 85% - 84.77% = 0.23%.
(e) Trimmed out – cumulative weight above 85%. |
| | |
Table 5: Expenditure classes included in the Trimmed mean ranked from lowest to highest by percentage change from previous quarter, June quarter 2011
Expenditure class included in the Trimmed mean
(1) | June quarter 2011, percentage change from previous quarter (seasonally adjusted)
(2) | Trimmed March quarter 2011, relative weights % (seasonally adjusted)
(3) | Rescaled March quarter 2011, relative weights % (seasonally adjusted)
(4) |
| | | |
| Automotive fuel | -0.5 | 1.71 | 2.44 |
| Eggs | -0.3 | 0.10 | 0.14 |
| Motor vehicle parts and accessories | -0.2 | 0.71 | 1.01 |
| Motor vehicles | -0.2 | 3.97 | 5.67 |
| Children and infants' clothing | -0.2 | 0.31 | 0.44 |
| Soft drinks, waters and juices | 0.0 | 0.99 | 1.41 |
| Floor and window coverings | 0.0 | 0.72 | 1.02 |
| Audio, visual and computing media and services | 0.0 | 1.17 | 1.66 |
| Overseas holiday travel and accommodation | 0.1 | 1.69 | 2.41 |
| Tools | 0.2 | 0.31 | 0.44 |
| Books | 0.2 | 0.39 | 0.56 |
| Food additives and condiments | 0.3 | 0.28 | 0.40 |
| Newspapers and magazines | 0.3 | 0.39 | 0.56 |
| Beef and veal | 0.3 | 0.43 | 0.61 |
| Spirits | 0.3 | 1.00 | 1.43 |
| Pharmaceuticals | 0.4 | 1.02 | 1.46 |
| Tobacco | 0.4 | 3.16 | 4.52 |
| Telecommunication | 0.4 | 2.71 | 3.87 |
| Beer | 0.4 | 2.08 | 2.97 |
| Optical services | 0.4 | 0.11 | 0.15 |
| Women's outerwear | 0.4 | 0.84 | 1.21 |
| Glassware, tableware and household utensils | 0.4 | 0.38 | 0.54 |
| Household cleaning agents | 0.4 | 0.29 | 0.41 |
| House purchase | 0.5 | 7.97 | 11.38 |
| House repairs and maintenance | 0.5 | 2.15 | 3.07 |
| Fish and other seafood | 0.6 | 0.43 | 0.61 |
| Dental services | 0.6 | 0.72 | 1.03 |
| Sports participation | 0.6 | 0.77 | 1.10 |
| Other motoring charges | 0.6 | 1.15 | 1.65 |
| Tertiary education | 0.8 | 1.31 | 1.87 |
| Clothing services and shoe repair | 0.8 | 0.16 | 0.23 |
| Take away and fast foods | 0.8 | 2.72 | 3.88 |
| Other financial services | 0.9 | 3.18 | 4.54 |
| Men's underwear, nightwear and socks | 1.0 | 0.10 | 0.14 |
| Major household appliances | 1.0 | 0.51 | 0.74 |
| Cakes and biscuits | 1.0 | 0.75 | 1.08 |
| Hairdressing and personal care services | 1.0 | 0.76 | 1.09 |
| Rents | 1.0 | 5.90 | 8.43 |
| Hospital and medical services | 1.1 | 3.19 | 4.56 |
| Poultry | 1.1 | 0.43 | 0.61 |
| Other recreational activities | 1.1 | 1.20 | 1.71 |
| Other household services | 1.2 | 0.66 | 0.94 |
| Gas and other household fuels | 1.2 | 0.85 | 1.21 |
| Restaurant meals | 1.3 | 2.03 | 2.90 |
| Snacks and confectionery | 1.3 | 1.09 | 1.55 |
| Preschool primary education | 1.4 | 0.59 | 0.84 |
| Cheese | 1.4 | 0.36 | 0.52 |
| Property rates and charges | 1.4 | 1.35 | 1.93 |
| Other cereal products | 1.5 | 0.19 | 0.27 |
| Secondary education | 1.5 | 1.15 | 1.64 |
| Breakfast cereals | 1.6 | 0.18 | 0.26 |
| Child care | 1.7 | 0.31 | 0.44 |
| Electricity | 1.7 | 2.27 | 3.24 |
| Pet services including veterinary | 1.8 | 0.46 | 0.66 |
| Jams, honey and sandwich spreads | 1.8 | 0.15 | 0.21 |
| Domestic holiday travel and accommodation | 1.9 | 0.23 | 0.33 |
| | | |
| TOTAL | | 70.00 | 100.00 |
FORMULAE
 Print Page
 Print All