OUTPUT
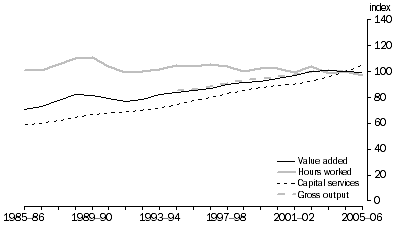
Growth in Manufacturing value added is shown in figure 5.2. It shows a steady increase since the early 1990s, but has declined slightly since 2003-04.
Figure 5.2 also shows growth in gross output for Manufacturing, and it follows a similar pattern to value added, with its growth slightly slower than value added. Given the small differences between value added and gross output, the differences between the value added based MFP growth and gross output based MFP growth come from the combined inputs index, with intermediate inputs having the largest influence.
Based on current price shares of value added, Food, beverage & tobacco is the largest subdivision in the Manufacturing industry followed by the Machinery & equipment subdivision, and the Metal Products subdivision. Growth in value added for each of these subdivisions has a similar trend to the Manufacturing industry as a whole.
5.2 Manufacturing outputs and inputs, (2004-05 = 100)

 Print Page
 Print All
 Print Page
 Print All