PRODUCTIVITY
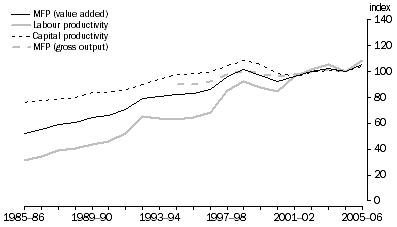
Value added based MFP growth trended upward from 1985-86 to 1998-99. In 1999-00 there was a significant fall in MFP as inputs continued to rise while output slowed, with growth resuming an upward trend in 2001-02. The 1990s saw a series of changes within the industry such as corporatisation, deregulation and extra competition in the market, which are likely to have affected productivity growth. Changes to output composition, such as the introduction of the internet and mobile telephone services, are also likely to have affected productivity growth. A comparison between gross output MFP and value added MFP shows that value added MFP has been growing at a faster rate than gross output MFP measure, but in a similar pattern (figure 12.1).
12.1 COMMUNICATION SERVICES MFP, LABOUR AND CAPITAL PRODUCTIVITY, (2004-05 = 100)

Labour productivity in the Communications industry displays significant growth (figure 12.1). Labour productivity growth from 1985-86 to 2005-06 averaged 6.5% per year, significantly higher than the market sector average. This was due to high growth in value added and slow growth in employment, with employment growth averaging around 1% per year from 1985-86 to 2005-06.
Capital productivity displayed slower growth when compared to labour productivity and MFP, although it had a similar pattern. Capital productivity displayed the same peak in 1999-00 followed by a significant decline.
 Print Page
 Print All