CAPITAL INPUTS
Capital services recorded strong growth, averaging 5.7% per year between 1985-86 and 2005-06 (figure 14.2). This is almost twice as fast as value added growth. Capital services are affected by changes in gross fixed capital formation (GFCF) and this drives growth in the productive capital stock.
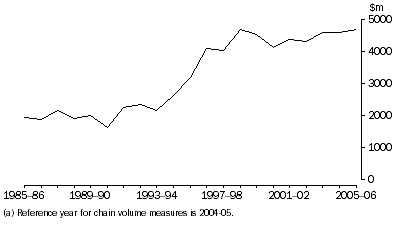
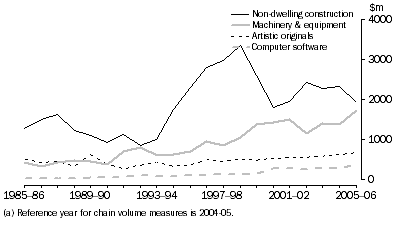
Figure 14.3 shows GFCF for Cultural & recreational services. Between 1993-94 and 1998-99, there was rapid growth in GFCF. This growth appears to be a level shift in investment as growth prior to 1993-94 and post 1998-99 are both relatively flat. This shift is also reflected in the capital services series, which shows a change in growth around 1996-97 (figure 14.2). One possible reason for this short period of strong growth is due to the increase in non-dwelling construction GFCF as a result of the announcement of the hosting the Olympics (figure 14.4).
The growth of non-dwelling construction GFCF is important because capacity utilisation may be an issue that requires further consideration. Capacity utilisation of Cultural & recreational facilities such as concert halls and sports stadium are likely to vary significantly in the short term. However, it would be difficult to ascertain whether the rate of capacity utilisation changes over the long term.
14.3 Cultural & recreational services Gross fixed capital formation, Chain volume measures (a)

14.4 Culture & recreational services GFCF by asset, Chain volume measures (a)

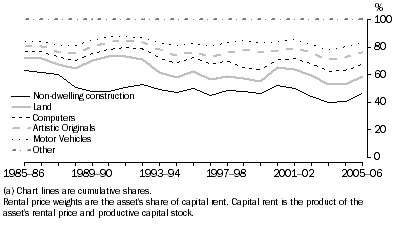
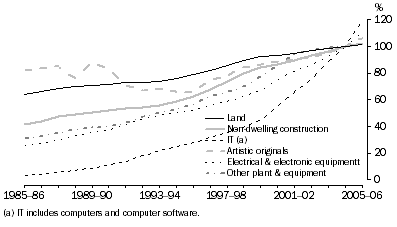
In addition to GFCF, rental price weights (figure 14.5) also influence capital services. Since 1985-86 rental price weights for non-dwelling construction declined. This was due to slower growth in the productive capital stock for non-dwelling construction compared to other assets (figure 14.6). Other assets with relatively large rental price weights are land, artistic originals, electrical and electronic equipment and motor vehicles, which all increased their respective shares over the last 20 years.
14.5 Culture & recreational services rental price weights (a)

Figure 14.6 shows strong growth in productive capital stock between 1993-94 and 1998-99 for non-dwelling construction. However, most other assets experienced even stronger growth over the later half of the 1990s, such as electrical and electronic equipment and other plant and equipment.
14.6 Culture & recreational services Productive capital stock, (2004-05 = 100)

 Print Page
 Print All