 SUMMARY
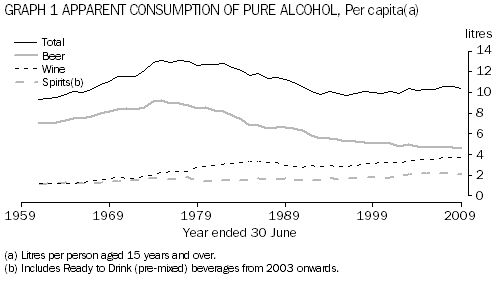
For most of the past 50 years apparent consumption of alcohol in Australia has increased, from around 68 million litres of pure alcohol in 1960-61 to 183 million litres in 2008-09. However, in per capita terms (that is, average alcohol consumption per person aged 15 years and over) a different picture emerges, with Australia experiencing periods of both increasing and decreasing apparent per capita consumption (Graph 1).
Between the early 1960s and mid 1970s apparent per capita consumption increased steadily, from an average 9.3 litres of pure alcohol per person to a peak of 13.1 litres of pure alcohol per person in 1974-75. Apparent per capita consumption remained relatively steady for the next 5-10 years, then declined over the following decade, reaching 9.8 litres per person in 1995-96.
Since then, apparent per capita consumption has slowly increased, to 10.4 litres of pure alcohol in 2008-09. Given a standard drink consists of 12.5 mls of pure alcohol, this is equivalent to an average of 2.3 standard drinks per day per person aged 15 years and over. In comparison, apparent per capita consumption in 1974-75 was equivalent to 2.9 standard drinks per day per person. Note that these figures will overestimate the true level of alcohol consumed as beverages, as adjustments cannot be made for wastage and other factors such as the use of alcohol in cooking.

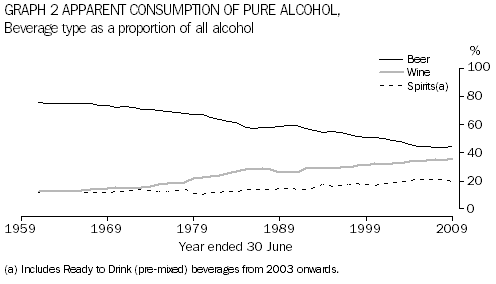
Over the past 50 years, the level of apparent consumption of different alcoholic beverages has changed substantially; in particular, the proportion of pure alcohol available for consumption in the form of beer has decreased (from 76% to 44%), while the proportions in the form of wine and spirits have increased (from 12% to 36% and 12% to 20% respectively) (Graph 2).

A wide range of factors may have affected patterns of consumption of pure alcohol in Australia, although it is difficult to attribute any one factor to particular changes in the data. Changes in the age structure of the Australian population, changing economic conditions (and the resulting effects on employment rates and levels of disposable income, for example) as well as changing consumer preferences may have had the effect of increasing or reducing apparent per capita consumption at different times over the past 50 years. In addition, some factors that may have contributed to increases are:
- the increasing affluence of the Australian population in years following World War II;
- the arrival of large numbers of post-World War II migrants from European countries with traditional cultural associations with wine;
- changing legislative and social conditions through the 1970s, such as the introduction of anti-discrimination laws (for example, in relation to the preclusion of women drinking in public bars in Australia);
- growth of the Australian wine industry;
- changes in viticultural and climatic conditions, leading to higher alcohol content in wines; and
- a wider range of choice available to consumers.
Conversely, some factors that may have had the effect of reducing consumption are:
- legislative changes such as the introduction of random breath testing in the states and territories (between 1976 and 1988);
- changes in excise imposed upon the sale of alcohol (that is, taxation);
- greater government focus on and community awareness of the negative health effects of alcohol use; and
- the introduction of low alcohol beers.
TABLE 1: PURE ALCOHOL AVAILABLE FOR CONSUMPTION - ALL ALCOHOL TYPES
|
 | Volume of pure alcohol
('000 litres)
|  | Per capita consumption of pure alcohol(a)
(litres)
|
| Year ended 30 June(b) | Beer | Wine | Spirits(c) | Total |  | Beer | Wine | Spirits(c) | Total |
|
| 1949 | 30 410 | na | na | na |  | 5.25 | na | na | na |
| 1959 | 48 157 | na | na | na |  | 6.92 | na | na | na |
| 1969 | 70 211 | 14 405 | 11 166 | 95 782 |  | 8.15 | 1.67 | 1.30 | 11.12 |
| 1979 | 90 649 | 29 402 | 15 402 | 135 453 |  | 8.47 | 2.75 | 1.44 | 12.66 |
| 1989 | 85 819 | 38 493 | 21 488 | 145 800 |  | 6.62 | 2.97 | 1.66 | 11.25 |
| 1999 | 75 607 | 46 540 | 26 298 | 148 445 |  | 5.08 | 3.13 | 1.77 | 9.98 |
| 2009 | 81 148 | 65 600 | 35 921 | 182 669 |  | 4.62 | 3.73 | 2.04 | 10.40 |
|
| na not available |
| (a) Litres per person aged 15 years and over. |
| (b) See data cube for all years 1944-45 to 2008-09. |
| (c) Includes Ready to Drink (pre-mixed) beverages from 2003 onwards. |
 Print Page
 Print All
 Quality Declaration