NORTHERN TERRITORY
Homes owned with a mortgage
- In 2011, 30.6% of homes were owned with a mortgage in the Northern Territory, compared with 34.9% for Australia.
- The Local Government Area (LGA) with the highest proportion of homes owned with a mortgage in the Northern Territory was Litchfield (50.1%), while LGAs located in remote areas had the lowest proportions.
- The proportions of homes owned with a mortgage in Darwin and Palmerston were 31.7% and 42.2% respectively. Alice Springs and Katherine had proportions of 37.2% and 26.5% respectively.
HOMES OWNED WITH A MORTGAGE(a), by Local Government Area, Northern Territory, 2011
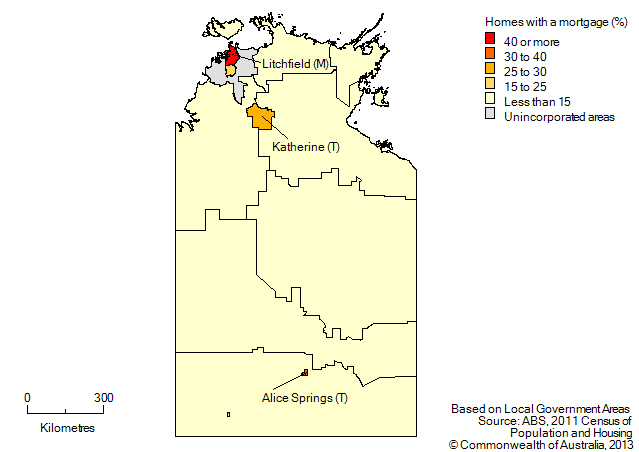 (a) The number of occupied private dwellings which were owned with a mortgage or being purchased under a rent/buy scheme
by a member of the household, expressed as a proportion of total occupied private dwellings.
Excludes 'Visitor only' and 'Other non-classifiable' households.
Median monthly mortgage repayments over time
- In the Northern Territory, the LGA with the fastest growth in median monthly mortgage repayments between 2006 and 2011 was Victoria-Daly (125.4%), located in the north-west of the territory.
- The LGAs in Greater Darwin with the fastest growth in mortgage costs were Palmerston and Litchfield, both with 66.7%.
FASTEST GROWTH IN MEDIAN MONTHLY MORTGAGE REPAYMENTS(a), by Local Government Area(b), Northern Territory, 2006 and 2011
|
| Local Government Area | Median Mortgage Repayment | Change |
|
2006
($/month) | 2011
($/month) | ($) | (%) |
|
| Greater Darwin |
| Palmerston | 1 300 | 2 167 | 867 | 66.7 |
| Litchfield | 1 300 | 2 167 | 867 | 66.7 |
| Darwin | 1 326 | 2 167 | 841 | 63.4 |
| Rest of the Northern Territory |
| Victoria-Daly | 370 | 834 | 464 | 125.4 |
| Katherine | 1 083 | 1 733 | 650 | 60.0 |
| Alice Springs | 1 300 | 1 950 | 650 | 50.0 |
| Barkly | 650 | 922 | 272 | 41.8 |
| MacDonnell | 1 500 | 1 625 | 125 | 8.3 |
|
| (a) Applicable to occupied private dwellings which were owned with a mortgage or being purchased under a rent/buy scheme by a member of the household. Excludes 'Visitor only' and 'Other non-classifiable' households. |
| (b) LGAs with a total occupied private dwelling count under 500 dwellings in 2011 are excluded from this table. |
| Cells in this table have been randomly adjusted to avoid the release of confidential data. |
| Source: ABS Census of Population and Housing, 2006 and 2011. |
 Print Page
 Print All