EXPENDITURE
Recurrent expenditure for Acute and psychiatric hospitals during 2010-11 amounted to $8,949 million, up 7.1% from 2009-10.
Wages and salaries (including on-costs such as employer contributions to superannuation and payroll tax) represented 50.6% of recurrent expenditure in 2010-11, down from 51.6% in 2009-10. Victoria recorded the highest proportion of total recurrent expenditure that was spent on wages and salaries, at 52.6%, while New South Wales had the lowest proportion, at 48.4%.
The next largest component of recurrent expenditure was Drug, medical, pharmaceutical and surgical supplies, which accounted for 27.7% of the total, as it was in 2009-10. This varied from 23.5% in Western Australia to 29.9% in New South Wales.
When recurrent expenditure is adjusted to remove the effects of price changes over the period, the average annual increase over the ten years from 2000-01 ($5,775 million) to 2010-11 ($8,828 million) was 4.3%. For further information on the use of chain volume measures to adjust income and expenditure, see Explanatory Note 25.
Acute and Psychiatric Private Hospitals, Real income and expenditure(a) : 2006–07 to 2010–11(b)
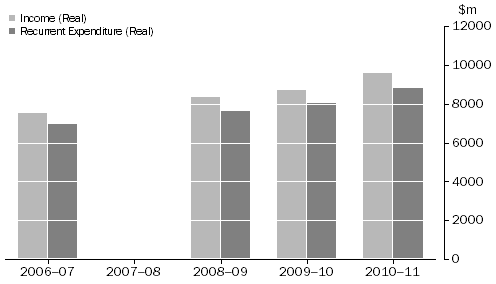
(a) Laspeyres input cost index was used to provide real income and expenditure. See Explanatory Note 25 for further information.
(b) Data for the 2007–08 reference year are not available. See Explanatory Note 4 for further information.
The average expenditure per patient day was $1,123 in 2010-11 compared with $1,102 in 2009-10. This ranged from $1,270 per patient day in in Western Australia to $1,100 per patient day in Victoria
. When average expenditure per patient day is adjusted to remove the effects of price changes over the period, the average annual increase over the ten years from 2000-01 ($886) to 2010-11 ($1,108) was 2.3%.
Gross capital expenditure for Acute and psychiatric hospitals during 2010-11 increased by 13.3% from 2009-10 to $788 million.
In the three largest states, over 60% of the gross capital expenditure was spent on Land and buildings
, with Major medical equipment accounting for just under 20%. Capital expenditure is volatile in the Private Health sector. Significant purchases or construction undertaken in any given year are unlikely to be repeated on a regular basis. Net capital expenditure totalled $757 million in 2010-11.
Acute and Psychiatric Private Hospitals, Expenditure (a) per patient
day
: 2006-07 to 2010-11(b)
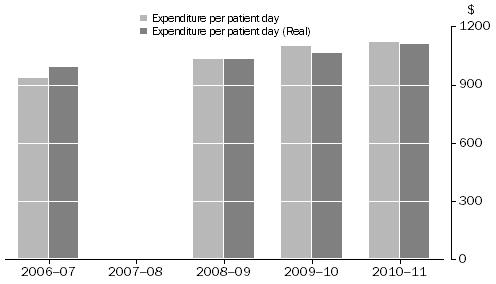
(a) Laspeyres input cost index was used to provide real expenditure. See Explanatory Note 25 for further information.
(b) Data for the 2007–08 reference year are not available. See Explanatory Note 4 for further information.
Table 2.15 PRIVATE ACUTE AND PSYCHIATRIC HOSPITALS, Expenditure —State and territories - 2010-11
|
 | | NSW | Vic. | Qld | SA | WA | Tas., NT & ACT(a) | Aus. |
|
| Expenditure ($'000)(b) | | | | | | | |
| Labour costs, including on-costs | | | | | | | |
| | Wages and salaries, including on-costs | 1 176 153 | 1 260 474 | 1 036 265 | np | 590 986 | np | 4 531 135 |
| | Contract/consultancy payments for medical/health services | 61 304 | 63 848 | 44 308 | np | 51 455 | np | 241 422 |
| Drug, medical, pharmaceuticals and surgical supplies(c) | 727 809 | 627 794 | 569 094 | np | 271 794 | np | 2 479 410 |
| Food supplies | 31 526 | 30 044 | 33 706 | 6 833 | 17 364 | 3 138 | 122 611 |
| Repair and maintenance | 31 567 | 16 179 | 30 138 | np | 14 271 | np | 101 135 |
| Fuel and power | 27 232 | 23 333 | 24 263 | np | 12 389 | np | 98 249 |
| Patient transport | 983 | 4 899 | 203 | np | 1 550 | np | 8 732 |
| Depreciation and amortisation | 83 736 | 83 547 | 88 442 | np | 40 222 | np | 321 488 |
| Interest | 12 237 | 12 119 | 12 756 | np | 2 778 | np | 49 743 |
| Non-labour contract expenses | 80 746 | 109 765 | 59 919 | np | 28 233 | np | 310 287 |
| Other (d) | 197 076 | 165 868 | 141 322 | np | 106 265 | np | 684 690 |
| Total (e) | 2 430 369 | 2 397 870 | 2 040 416 | np | 1 137 307 | np | 8 948 902 |
|
| Wages and salaries, including on-costs, as a proportion of total expenditure (%) | 48.4 | 52.6 | 50.8 | 49.0 | 52.0 | 50.6 | 50.6 |
| Average expenditure ($)(f) |
| Per patient separation | 3 140 | 3 308 | 3 194 | np | 3 217 | np | 3 171 |
| Per patient day | 1 140 | 1 100 | 1 083 | np | 1 270 | np | 1 123 |
|
| Gross Capital expenditure ($'000)(g) | | | | | | | |
| Land and buildings | 228 293 | 129 777 | 98 545 | np | 7 465 | np | 473 478 |
| Major medical equipment | 69 385 | 37 847 | 30 979 | np | 15 620 | np | 166 471 |
| Information technology | 11 421 | 12 617 | 4 571 | np | 2 437 | np | 31 796 |
| Other capital expenditure | 50 422 | 23 666 | 23 889 | np | 6 945 | np | 115 930 |
| Total (e) | 359 521 | 203 907 | 157 984 | np | 32 467 | np | 787 675 |
| Net Capital expenditure ($'000)(g) |
| Land and buildings | 228 293 | 113 497 | 97 294 | np | 7 465 | np | 455 767 |
| Major medical equipment | 68 387 | 33 102 | 30 684 | np | 15 150 | np | 159 855 |
| Information technology | 11 420 | 12 354 | 4 555 | np | 2 420 | np | 31 487 |
| Other capital expenditure | 48 868 | 20 287 | 23 164 | np | 6 704 | np | 109 975 |
| Total (e) | 356 968 | 179 240 | 155 697 | np | 31 739 | np | 757 084 |
|
np not available for publication but included in totals where applicable, unless otherwise indicated
(a) Tasmania, the Northern Territory and the Australian Capital Territory have been aggregated to protect the confidentiality of the small number of hospitals in these states/territories.
(b) Expenditure refers to expenditure on goods and services, which does not result in the creation or acquisition of fixed assets (new or second-hand). See Glossary for further information.
(c) Including surgically implanted prostheses and homograft items.
(d) Including contract services.
(e) Figures have been rounded and discrepancies may occur between totals and the sums of the component items.
(f) Average expenditure figures can vary considerably between hospitals depending on the type of services they provide.
(g) Capital expenditure refers to expenditure in a period on the acquisition or enhancement of an asset (excluding financial assets). See Glossary for further information. Note that 2010-11 is the first year the ABS has had gross and net capital expenditure available for publication. |
For profit hospitals had a lower average expenditure per patient day ($989) than Religious or charitable Not for profit hospitals ($1291) and Other Not for profit hospitals ($1,229) in 2010-11. In 2009-10, For profit hospitals spent $994 per patient day, compared to $1,248 for Religious or charitable Not for profit hospitals and $1,044 for Other Not for profit hospitals.
For profit hospitals and Religious or charitable Not for profit hospitals spent a slightly higher proportion of their total expenditure on wages and salaries (both 50.7%) than the Other Not for profit hospitals (49.2%). The largest percentage point change from 2009-10 was experienced by the Other Not for profit hospitals, who spent 53.5% of their total expenditure on wages and salaries in 2009-10.
Around two thirds (66.9%) of all gross capital expenditure undertaken by Australian Acute and psychiatric private hospitals was undertaken by the For profit sector. The largest component of gross capital expenditure was land and buildings, with nearly two thirds (65.4%) of gross capital expenditure by For profit hospitals being invested in land and buildings.
Table 2.16 PRIVATE ACUTE AND PSYCHIATRIC HOSPITALS, Expenditure — For profit/not for profit sector (a) - 2010-11
|
| | | | | | |
| | | For profit | Religious or charitable | Other (b) | Total |
|
| Expenditure ($'000)(c) | | | | |
| Labour costs, including on-costs | | | | |
| | Wages and salaries, including on-costs | 2 180 292 | 2 166 062 | 184 781 | 4 531 135 |
| | Contract/consultancy payments for medical/health services | 174 115 | 58 685 | 8 622 | 241 422 |
| Drug, medical, pharmaceuticals and surgical supplies(d) | 1 198 824 | 1 188 719 | 91 867 | 2 479 410 |
| Food supplies | 57 563 | 59 911 | 5 137 | 122 611 |
| Repair and maintenance | 52 321 | 44 982 | 3 832 | 101 135 |
| Fuel and power | 48 242 | 44 523 | 5 484 | 98 249 |
| Patient transport | 5 649 | 2 784 | 299 | 8 732 |
| Depreciation and amortisation | 136 586 | 174 907 | 9 995 | 321 488 |
| Interest | 13 887 | 29 332 | 6 524 | 49 743 |
| Non-labour contract expenses | 123 027 | 156 092 | 31 168 | 310 287 |
| Other (e) | 310 360 | 346 473 | 27 857 | 684 690 |
| Total (f) | 4 300 866 | 4 272 470 | 375 566 | 8 948 902 |
|
| Wages and salaries, including on-costs, as a proportion of total expenditure (%) | 50.7 | 50.7 | 49.2 | 50.6 |
| Average expenditure ($)(g) |
| Per patient separation | 2 759 | 3 696 | 3 519 | 3 171 |
| Per patient day | 989 | 1 291 | 1 229 | 1 123 |
|
| Gross Capital expenditure ($'000)(h) | | | | |
| Land and buildings | np | 124 048 | np | 473 478 |
| Major medical equipment | np | 64 655 | np | 166 471 |
| Information technology | 10 776 | 20 685 | 335 | 31 796 |
| Other capital expenditure | 71 449 | 43 267 | 1 214 | 115 930 |
| Total (f) | 527 063 | 252 655 | 7 957 | 787 675 |
| Net Capital expenditure ($'000)(h) |
| Land and buildings | np | 123 055 | np | 455 767 |
| Major medical equipment | np | 62 697 | np | 159 855 |
| Information technology | 10 558 | 20 606 | 323 | 31 487 |
| Other capital expenditure | 66 903 | 41 986 | 1 086 | 109 975 |
| Total (f) | 501 190 | 248 344 | 7 550 | 757 084 |
|
np not available for publication but included in totals where applicable, unless otherwise indicated
(a) For definition of 'For Profit/not for profit sector', see Glossary.
(b) Comprising bush nursing, community and memorial hospitals.
(c) Expenditure refers to expenditure on goods and services, which does not result in the creation or acquisition of fixed assets (new or second-hand). See Glossary for further information.
(d) Including surgically implanted prostheses and homograft items.
(e) Including contract services
(f) Total may include figures where providers were able to provide a total expenditure figure, without further breakdown of expenditure items, therefore the total will not equate to the sum of the individual items.
(g) Average expenditure figures can vary considerably between hospitals depending on the type of services they provide.
(h) Capital expenditure refers to expenditure in a period on the acquisition or enhancement of an asset (excluding financial assets). See Glossary for further information. Note that 2010-11 is the first year the ABS has had gross and net capital expenditure available for publication. |
The average cost per patient day rose as hospital size increased, with the exception of the 0-25 bed hospitals.. This reflects the greater complexity of procedures undertaken at the larger hospitals. In 2010-11, recurrent expenditure per patient day (unadjusted for price changes) at Acute and psychiatric hospitals with over 200 beds was $1,369 compared with the average of $677 for hospitals with 26-50 beds.
The proportion of total expenditure that is spent on wages and salaries varied from 48.4% of expenditure by hospitals with 101-200 beds to 55.7% of expenditure by hospitals with 26-50 beds.
Table 2.17 PRIVATE ACUTE AND PSYCHIATRIC HOSPITALS, Expenditure —Hospital size (a) - 2010-11
|
| | | Number of beds |
| | | 0-25 | 26-50 | 51-100 | 101-200 | Over 200 | Total (e) |
|
| Expenditure ($'000)(b) | | | | | | |
| Labour costs, including on-costs | | | | | | |
| | Wages and salaries, including on-costs | 64 433 | 214 641 | 916 568 | 1 415 670 | 1 919 823 | 4 531 135 |
| | Contract/consultancy payments for medical/health services | 2 538 | 16 481 | 46 600 | 89 780 | 86 023 | 241 422 |
| Drug, medical, pharmaceuticals and surgical supplies(c) | 24 104 | 63 964 | 394 883 | 844 325 | 1 152 134 | 2 479 410 |
| Food supplies | 1 717 | 7 437 | 24 877 | 35 842 | 52 738 | 122 611 |
| Repair and maintenance | 1 565 | 6 786 | 21 103 | 29 192 | 42 489 | 101 135 |
| Fuel and power | 2 156 | 5 350 | 21 190 | 32 954 | 36 599 | 98 249 |
| Patient transport | 98 | 269 | 1 328 | 4 370 | 2 667 | 8 732 |
| Depreciation and amortisation | 5 339 | 12 040 | 62 088 | 99 623 | 142 398 | 321 488 |
| Interest | 1 324 | 4 952 | 12 171 | 19 013 | 12 283 | 49 743 |
| Non-labour contract expenses | 5 922 | 17 369 | 60 339 | 108 508 | 118 149 | 310 287 |
| Other (d) | 17 373 | 35 752 | 118 813 | 245 052 | 267 700 | 684 690 |
| Total (e) | 126 569 | 385 041 | 1 679 960 | 2 924 329 | 3 833 003 | 8 948 902 |
|
| Wages and salaries, including on-costs, as a proportion of total expenditure (%) | 50.9 | 55.7 | 54.6 | 48.4 | 50.1 | 50.6 |
| Average expenditure ($)(f) |
| Per patient separation | 2 161 | 1 993 | 2 312 | 3 208 | 4 114 | 3 171 |
| Per patient day | 934 | 677 | 824 | 1 207 | 1 369 | 1 123 |
|
| Gross Capital expenditure ($'000)(g) |
| Land and buildings | 6 440 | 17 408 | 75 463 | 196 712 | 177 455 | 473 478 |
| Major medical equipment | 18 591 | 5 609 | 24 537 | 61 675 | 56 059 | 166 471 |
| Information technology | 3 106 | 1 016 | 3 976 | 5 750 | 17 948 | 31 796 |
| Other capital expenditure | 3 285 | 6 458 | 24 621 | 45 968 | 35 598 | 115 930 |
| Total (e) | 31 422 | 30 491 | 128 597 | 310 105 | 287 060 | 787 675 |
| Net Capital expenditure ($'000)(g) |
| Land and buildings | 6 440 | 17 228 | 59 183 | 196 337 | 176 579 | 455 767 |
| Major medical equipment | 18 591 | 5 261 | 20 476 | 60 314 | 55 213 | 159 855 |
| Information technology | 3 106 | 751 | 3 976 | 5 732 | 17 922 | 31 487 |
| Other capital expenditure | 3 275 | 6 319 | 20 444 | 44 938 | 34 999 | 109 975 |
| Total (e) | 31 412 | 29 559 | 104 079 | 307 321 | 284 713 | 757 084 |
|
np not available for publication but included in totals where applicable, unless otherwise indicated
(a) Based on number of available beds (average for the year).
(b) Refers to expenditure on goods and services, which does not result in the creation or acquisition of fixed assets (new or second-hand). See Glossary for further information.
(c) Including surgically implanted prostheses and homograft items.
(d) Including contract services.
(e) Figures have been rounded and discrepancies may occur between totals and the sums of the component items.
(f) Average expenditure figures can vary considerably between hospitals depending on the type of services they provide.
(g) Capital expenditure refers to expenditure in a period on the acquisition or enhancement of an asset (excluding financial assets). See Glossary for further information. Note that 2010-11 is the first year the ABS has had gross and net capital expenditure available for publication. |
 Quality Declaration
  Print Page
 Print All