As well as Australia's national accounts, the ABS produces annual accounts for each of Australia's states and territories. These provide estimates of gross state product (GSP) and state final demand. GSP is produced by summing the incomes generated in the production process (the income approach to measuring total production). State final demand is equal to the sum of government and household final consumption expenditure and public and private gross fixed capital formation. Estimates of state final demand and GSP are available in both current price and chain volume terms. The chain volume GSP estimates are experimental.
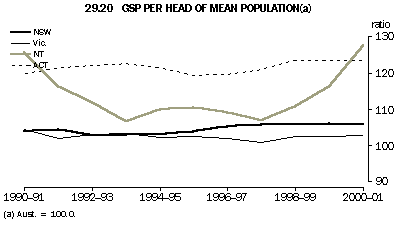
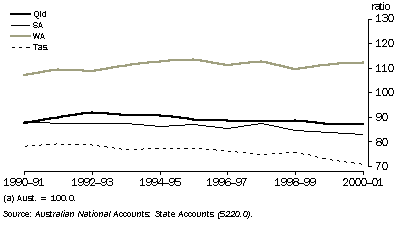
An important use of state accounts is to compare the performance of each state and territory. Graph 29.20 shows the ratio of GSP, in current prices, per head of mean population for each state and territory to the Australian value (GDP per head of mean population) since 1990-91. For New South Wales, Victoria, Western Australia, Northern Territory and Australian Capital Territory, GSP per head of mean population has been above the national average. For Queensland, South Australia and Tasmania, GSP per head of mean population has been below the national average.
 Print Page