|
|
Australia's net international investment position is the difference between the levels of Australia's foreign financial liabilities and the levels of its foreign financial assets. Historically, Australia has had a net liability position with the rest of the world.
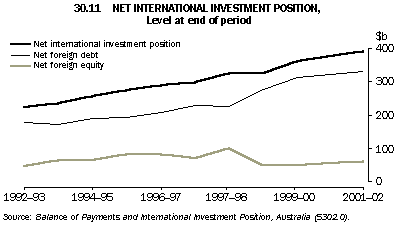
Australia's net international investment position at 30 June 2002 was a net foreign financial liability of $390.5b. This was up $29.5b (8.2%) on the position a year earlier and resulted from net increases of $13.2b in the level of foreign equity and $16.3b in the level of foreign debt.
Graph 30.11 shows the components of Australia's international investment position between 1992-93 and 2001-02. It shows that the increases in net foreign liabilities reflect increases in both net foreign debt liabilities and net foreign equity liabilities in most years.

30.12 INTERNATIONAL INVESTMENT POSITION
|
 |  |  | Changes in position reflecting |  |
 |  |  |
|  |
 |  | Position at beginning of period | Transactions | Price changes | Exchange rate changes | Other
adjustments | Position at
end of period |
 |  | $m | $m | $m | $m | $m | $m |
|
NET INTERNATIONAL INVESTMENT POSITION |
|
| Total |  |  |  |  |  |  |
 | 1999-2000 | 321,655 | 30,919 | -16,224 | -9,193 | -653 | 326,505 |
 | 2000-01 | 326,505 | 14,339 | 30,211 | -6,238 | -3,782 | 361,034 |
 | 2001-02 | 361,034 | 20,286 | 10,064 | -216 | -641 | 390,527 |
| Equity |  |  |  |  |  |  |
 | 1999-2000 | 90,967 | -8,249 | -13,852 | -21,189 | 1,024 | 48,700 |
 | 2000-01 | 48,700 | 3,048 | 26,674 | -28,313 | -2,547 | 47,562 |
 | 2001-02 | 47,562 | -15,061 | 13,833 | 13,973 | 456 | 60,764 |
| Debt |  |  |  |  |  |  |
 | 1999-2000 | 230,689 | 39,168 | -2,373 | 11,996 | -1,677 | 277,804 |
 | 2000-01 | 277,804 | 11,289 | 3,537 | 22,076 | -1,234 | 313,472 |
 | 2001-02 | 313,472 | 35,345 | -3,768 | -14,189 | -1,097 | 329,763 |
|
FOREIGN ASSETS(a) |
|
| Total |  |  |  |  |  |  |
 | 1999-2000 | -325,163 | -27,334 | -47,638 | -27,051 | 1,162 | -426,024 |
 | 2000-01 | -426,024 | -49,779 | 32,718 | -39,109 | -1,356 | -483,551 |
 | 2001-02 | -483,551 | -48,421 | 47,642 | 13,366 | -1,285 | -472,251 |
| Equity |  |  |  |  |  |  |
 | 1999-2000 | -196,013 | -19,611 | -46,115 | -21,189 | 872 | -282,057 |
 | 2000-01 | -282,057 | -18,913 | 31,804 | -28,313 | -769 | -298,247 |
 | 2001-02 | -298,247 | -42,856 | 48,913 | 13,973 | -143 | -278,359 |
| Debt |  |  |  |  |  |  |
 | 1999-2000 | -129,150 | -7,722 | -1,523 | -5,860 | 288 | -143,967 |
 | 2000-01 | -143,967 | -30,867 | 913 | -10,794 | -588 | -185,304 |
 | 2001-02 | -185,304 | -5,565 | -1,272 | -608 | -1,143 | -193,891 |
|
FOREIGN LIABILITIES(b) |
|
| Total |  |  |  |  |  |  |
 | 1999-2000 | 646,818 | 58,254 | 31,414 | 17,857 | -1,814 | 752,528 |
 | 2000-01 | 752,528 | 64,118 | -2,507 | 32,870 | -2,426 | 844,584 |
 | 2001-02 | 844,584 | 68,707 | -37,578 | -13,582 | 645 | 862,778 |
| Equity |  |  |  |  |  |  |
 | 1999-2000 | 286,979 | 11,362 | 32,264 | - | 152 | 330,757 |
 | 2000-01 | 330,757 | 21,962 | -5,130 | - | -1,779 | 345,809 |
 | 2001-02 | 345,809 | 27,796 | -35,081 | - | 599 | 339,123 |
| Debt |  |  |  |  |  |  |
 | 1999-2000 | 359,839 | 46,890 | -850 | 17,857 | -1,965 | 421,771 |
 | 2000-01 | 421,771 | 42,155 | 2,624 | 32,870 | -647 | 498,775 |
 | 2001-02 | 498,775 | 40,910 | -2,497 | -13,582 | 47 | 523,654 |
|
(a) Assets include claims of Australian direct investment enterprises on direct investors abroad, which are classified as part of direct investment in Australia.
(b) Liabilities include liabilities of Australian direct investors to direct investment enterprises abroad, which are classified as part of direct investment abroad. |
Source: Balance of Payments and International Investment Position, Australia (5302.0). |
|
 Print Page