EDUCATION, EMPLOYMENT AND INCOME
The transition from education to work
The transition from school to continued study or full-time employment can have long-term implications. For example, those who are not fully engaged in either education and/or work (i.e. not in full-time work, full-time education or in a combination of both part-time work and part-time study) during this period may be at risk of becoming long-term unemployed, underemployed or only marginally attached to the labour force (ABS 2006f).
One-third (33%) of all Indigenous young people aged 18-24 years were fully engaged in work and/or study in 2006, similar to the rate reported in 2001 (31%). Indigenous males were more likely than Indigenous females to be fully engaged (36% compared with 29%), while participation in full-time work and/or study was higher among people in non-remote than remote areas (38% compared with 18%).
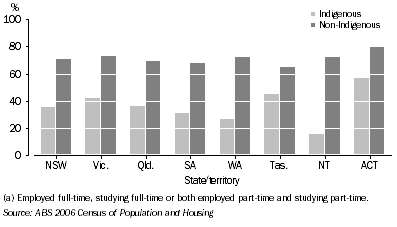
In 2006, Indigenous young people aged 18-24 years were half as likely as non-Indigenous young people to be engaged in either full-time work, full-time study or in both part-time work and part-time study (33% compared with 71%). Across the states and territories, there was relatively wide variation in the proportion of Indigenous young people fully engaged compared with non-Indigenous young people. Reflecting increased access to educational institutions and mainstream employment opportunities in urban areas, the ACT had the highest proportion of Indigenous young people fully participating in education and/or work (57%), followed by Tasmania (45%) and Victoria (42%) (graph 3.4).
3.4 FULLY ENGAGED IN EDUCATION AND/OR WORK(a), Persons aged 18-24 years
- 2006

Education and employment
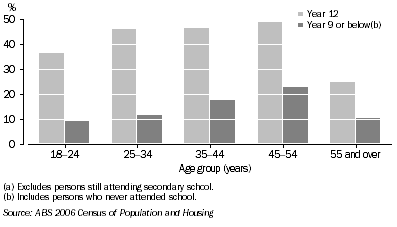
The positive effect that education has on an individual’s economic outcomes, particularly employment and income, has been well established (Biddle 2005). Results from the 2006 Census show that Indigenous people aged 15 years and over with higher levels of schooling (who were not currently attending secondary school) were more likely than those with lower levels of attainment to be in full-time employment. In every broad age group, Indigenous people who had completed Year 12 were more than twice as likely as those who had completed school to Year 9 or below to have a full-time job (graph 3.5). This was particularly the case for young people aged 18-24 years, where the rate of full-time employment among those who had completed Year 12 was four times as high as among those who had left school at Year 9 or below (37% compared with 9%).
3.5 HIGHEST YEAR OF SCHOOL COMPLETED(a), Indigenous persons in full-time employment
- 2006

Among those who had completed Year 12, the proportion of people in full-time employment was lower in the Indigenous population than in the non-Indigenous population (42% compared with 49%). Rates of part-time employment and non-participation in the labour force were similar for both groups. However, among Australians who had completed Year 12, Indigenous people were more than twice as likely as non-Indigenous people to be unemployed (7% compared with 3%) (table 3.6).
3.6 LABOUR FORCE STATUS, by highest year of school completed - Persons aged 15 years and over - 2006 |
|  |
 |  |  | Year 12 | Year 10/11 | Year 9 or below(a) |  |
 |  |  | Indigenous | Non-Indigenous | Indigenous | Non-Indigenous | Indigenous | Non-Indigenous |  |
|  |
| Employed |  |  |  |  |  |  |  |  |
 | Full-time | % | (b)41.7 | 49.2 | 29.8 | 42.2 | 13.7 | 19.2 |  |
 | Part-time | % | 20.5 | 20.6 | 18.7 | 17.9 | 14.0 | 9.5 |  |
 | Total(c) | % | 68.2 | 74.1 | 53.6 | 64.2 | 31.3 | 31.3 |  |
| Unemployed | % | 7.1 | 3.2 | 10.3 | 3.6 | 8.5 | 2.8 |  |
| Not in the labour force | % | 23.3 | 22.2 | 34.1 | 31.4 | 57.1 | 64.2 |  |
| Not stated | % | 1.4 | 0.6 | 2.0 | 0.8 | 3.1 | 1.6 |  |
| Persons aged 15 years and over | no. | 53 491 | 6 549 115 | 100 552 | 4 693 351 | 78 827 | 2 104 152 |  |
| Labour force participation rate | % | 75.3 | 77.2 | 63.9 | 67.8 | 39.8 | 34.2 |  |
| Unemployment rate | % | 9.5 | 4.1 | 16.1 | 5.3 | 21.4 | 8.3 |  |
|  |
| (a) Includes persons who never attended school. |
| (b) Unemployed persons as a proportion of those in the labour force. |
| (c) Includes persons for whom full-time/part-time status was not known and persons who were away from work in the last four weeks. |
| Source: ABS 2006 Census of Population and Housing |
The same pattern of association is evident among those who had completed a non-school qualification. Indigenous people aged 25-64 years who had a non-school qualification of a Certificate III or above were more than twice as likely as those without a non-school qualification to be employed full-time (52% compared with 23%). Indigenous women with a Certificate III or above were less likely than Indigenous men with the same level of qualification to be employed full-time, and were around twice as likely to be employed part-time or not be participating in the labour force. This reflects the fact that many women in this age group are likely to be caring for children full-time, or combining childcare with part-time employment (ABS 2006d).
In 2006, the difference in the full-time employment rates for Indigenous and non-Indigenous people with a Certificate III or above was 8 percentage points (52% compared with 60%) (table 3.7). This disparity in full-time employment rates was considerably lower than the difference between the full-time employment rates for Indigenous and non-Indigenous people with a non-school qualification (35% compared with 56%) and between Indigenous and non-Indigenous people without a non-school qualification (23% compared with 41%).
3.7 LABOUR FORCE STATUS, by non-school qualification - Persons aged 25-64 years - 2006 |
|  |
 |  |  | Non-school qualification |  |  |  |
 |  |  | Certificate III or above(a) | Other | Total | No non-school qualification | Total |  |
Indigenous |  |
|  |
| Employed |  |  |  |  |  |  |  |
 | Full-time | % | 51.8 | 16.1 | 34.9 | 22.8 | 27.7 |  |
 | Part-time | % | 18.7 | 11.7 | 15.4 | 17.4 | 16.6 |  |
 | Total(b) | % | 76.2 | 32.3 | 55.4 | 44.6 | 49.0 |  |
| Unemployed | % | 5.7 | 5.6 | 5.7 | 8.4 | 7.3 |  |
| Not in the labour force | % | 17.1 | 39.2 | 27.6 | 45.1 | 38.0 |  |
| Not stated | % | 0.9 | 22.9 | 11.3 | 1.9 | 5.7 |  |
| Persons aged 25-64 years | no. | 38 939 | 35 067 | 73 998 | 108 786 | 182 791 |  |
| Labour force participation rate | % | 82.0 | 37.9 | 61.1 | 53.0 | 56.3 |  |
| Unemployment rate | % | 7.0 | 14.8 | 9.3 | 15.8 | 13.0 |  |
Non-Indigenous |  |
|  |
| Employed |  |  |  |  |  |  |  |
 | Full-time | % | 60.3 | 38.3 | 56.5 | 41.1 | 50.0 |  |
 | Part-time | % | 18.7 | 20.0 | 18.9 | 19.4 | 19.1 |  |
 | Total(b) | % | 83.6 | 63.6 | 80.1 | 64.6 | 73.6 |  |
| Unemployed | % | 2.5 | 3.5 | 2.7 | 3.8 | 3.2 |  |
| Not in the labour force | % | 13.6 | 26.1 | 15.8 | 30.8 | 22.1 |  |
| Not stated | % | 0.3 | 6.7 | 1.4 | 0.7 | 1.1 |  |
| Persons aged 25-64 years | no. | 4 670 956 | 981 530 | 5 652 487 | 4 165 625 | 9 818 107 |  |
| Labour force participation rate | % | 86.1 | 67.2 | 82.8 | 68.5 | 76.7 |  |
| Unemployment rate | % | 2.9 | 5.3 | 3.2 | 5.6 | 4.1 |  |
|  |
| (a) Comprises Certificate levels 3 and 4, Diplomas and Advanced diplomas, Bachelor degrees, Graduate diplomas, Graduate certificates and Postgraduate degrees. |
| (b) Includes persons for whom full-time/part-time status was not known and persons who were away from work in the last four weeks. |
| Source: ABS 2006 Census of Population and Housing |
Education and income
In 2006, Indigenous people who had completed secondary school had higher incomes than those who had left school at lower grades. Among those who were employed, Indigenous people aged 15 years and over who had completed Year 12 had a median gross individual income of $620 per week compared with $405 per week for those who left school at Year 9 or below. Nevertheless, employed Indigenous people who had completed Year 12 had a lower median weekly income in 2006 than did employed non-Indigenous people with Year 12 ($620 per week compared with $811 per week).
Likewise, among those aged 25-64 years who were employed, Indigenous people with a Certificate III or above had one-and-a-half times the weekly income of those without a non-school qualification ($791 compared with $510). However, they still had a lower median weekly income compared with non-Indigenous people with the equivalent qualification level ($791 compared with $965).
 Print Page
 Print All