|
|
One measure of the importance of an industry is its contribution to the Australian economy. The size of the Australian economy is typically described in terms of GDP, and the structure and performance of the economy in terms of industry gross value added (GVA).
GDP is an estimate of the total market value of goods and services produced in Australia in a given period after deducting the cost of goods and services used up in the process of production (intermediate consumption), but before deducting consumption of fixed capital. This is also described as the unduplicated value of economic production. This measure avoids double counting the goods and services produced at successive stages of production. Accordingly, it is a measure of the value added in production.
Industry GVA is the term used to describe the unduplicated value of goods and services produced by individual industries. This measure removes the distortion caused by variations in the incidence of commodity taxes and subsidies across the output of individual industries. More information is provided in National accounts.
Table 13.3 provides details of industry GVA and GDP for 2001-02. Data are presented at a broad industry level, generally equating to the Division level of the Australian and New Zealand Standard Industrial Classification (ANZSIC) 1993. In the ANZSIC, individual businesses are assigned an appropriate industry category on the basis of their predominant activities.
In 2001-02, the value of Australian production (GDP) was $695,663m (in chain volume terms), an increase of 3.9% from 2000-01. The average annual rate of growth in GDP between 1991-92 and 2001-02 was also 3.9%. In 2001-02, the ratio of GDP to the estimated resident population (GDP per capita) was $35,693 per person.
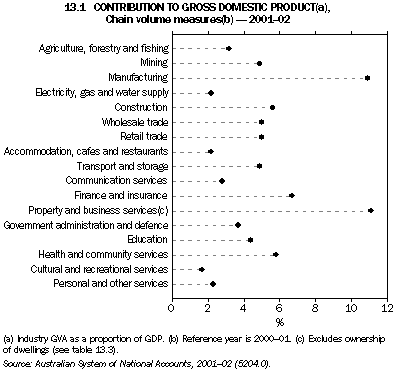
Graph 13.1 shows industry GVA shares of GDP. The property and business services industry contributed the most to GDP (11.1% or $77,162m) in 2001-02. This was closely followed by the manufacturing industry (10.9% of GDP or $75,573m). The finance and insurance industry was the third most important industry in terms of contribution to GDP, contributing 6.7% or $46,943m.
Property and business services only recently became the most significant industry in terms of its contribution to GDP, moving ahead of the manufacturing industry for the first time in 2000-01. The property and business services industry includes marketing and business management services, technical services, legal and accounting services, computer services, and property operators and developers services.
Between 1991-92 and 2001-02, the greatest increase in industry GVA shares of GDP was for the property and business services industry (2.0 percentage points). The next biggest increases were for the communication services (0.9 percentage points) and wholesale trade (0.4 percentage points) industries.
In the same 10-year period, the greatest fall in relative shares of GDP was for the manufacturing industry (-1.6 percentage points). The next largest decreases in relative shares were for the education (-0.7 percentage points), government administration and defence (-0.6 percentage points), and electricity, gas and water supply (-0.5 percentage points) industries.
13.3 PRODUCTION OF GOODS AND SERVICES(a), Chain volume measures(b)
|
 | 2001-02 | Change from 2000-01 | Average annual rate of growth
from 1991-92 to 2001-02 |
| $m | % | % |
|
| Agriculture, forestry and fishing | 22,119 | 2.3 | 3.9 |
| Mining | 33,865 | -0.3 | 3.5 |
| Manufacturing | 75,573 | 3.0 | 2.5 |
| Electricity, gas and water supply | 15,226 | -0.8 | 1.7 |
| Construction | 39,011 | 11.7 | 3.9 |
| Wholesale trade | 34,714 | 3.6 | 4.9 |
| Retail trade | 34,646 | 5.5 | 3.8 |
| Accommodation, cafes and restaurants | 15,350 | 4.1 | 4.2 |
| Transport and storage | 33,988 | 5.2 | 4.4 |
| Communication services | 19,814 | 3.0 | 8.4 |
| Finance and insurance | 46,943 | 4.6 | 4.3 |
| Property and business services(c) | 77,162 | 4.9 | 6.1 |
| Government administration and defence | 25,440 | 1.0 | 2.4 |
| Education | 30,317 | 1.5 | 2.3 |
| Health and community services | 40,438 | 5.8 | 3.9 |
| Cultural and recreational services | 11,821 | 0.3 | 3.0 |
| Personal and other services | 15,829 | 7.6 | 4.0 |
| Ownership of dwellings | 62,278 | 3.6 | 3.9 |
| Taxes less subsidies on products | 61,209 | 3.5 | 4.0 |
| Statistical discrepancy | -80 | . . | . . |
| GDP | 695,663 | 3.9 | 3.9 |
|
(a) Industry GVA.
(b) Reference year is 2000-01.
(c) Excludes ownership of dwellings. |
| | | |
| Source: Australian System of National Accounts, 2001-02 (5204.0). |
|
 Print Page