|
|
The Australian national income, expenditure and product accounts are compiled and published in some detail every quarter, in Australian National Accounts: National Income, Expenditure and Product (5206.0), and in greater detail once a year, in Australian System of National Accounts (5204.0).
GDP account
The GDP account indicates changes in Australian production over time. Tables 29.6 and 29.7 show the GDP account in current prices for a number of years between 1965-66 and 2002-03 - table 29.6 shows a series of snapshots at five-yearly intervals to 1990-91, while table 29.7 shows annual time series from 1995-96 to 2002-03. Table 29.8 shows expenditure on GDP in real or chain volume terms.
In real terms (i.e. after the effects of price change are removed from the dollar value of Australia's production), there was a fall in production during 1990-91. Since the recession in 1990-91, GDP has grown in each year. Although growth in 1991-92 was relatively low (0.3%), by 1995-96 it had accelerated to 4.2%, a growth rate which was generally maintained until 1999-2000. GDP growth has fluctuated since then, at 2.0%, 3.9% and 2.8% in 2000-01, 2001-02 and 2002-03 respectively.
29.6 GDP ACCOUNT, Current prices - Five-yearly intervals
|
 | | 1965-66 | 1970-71 | 1975-76 | 1980-81 | 1985-86 | 1990-91 |
| | $m | $m | $m | $m | $m | $m |
|
| Final consumption expenditure | | | | | | |
| General government | 3,146 | 5,547 | 14,715 | 27,123 | 49,760 | 74,663 |
| Households | 13,746 | 21,515 | 45,459 | 84,097 | 144,502 | 233,726 |
| Total final consumption expenditure | 16,892 | 27,062 | 60,175 | 111,220 | 194,263 | 308,390 |
| Gross fixed capital formation | | | | | | |
| Private | 5,082 | 8,388 | 13,328 | 29,256 | 45,959 | 67,027 |
| Public | 2,040 | 2,896 | 6,582 | 9,926 | 19,182 | 23,238 |
| Total gross fixed capital formation | 7,122 | 11,284 | 19,910 | 39,182 | 65,141 | 90,267 |
| Changes in inventories | 84 | 586 | 180 | 446 | 870 | -1,366 |
| Gross national expenditure | 24,098 | 38,933 | 80,265 | 150,849 | 260,274 | 397,291 |
| Exports of goods and services | 3,136 | 5,086 | 11,225 | 22,604 | 38,948 | 66,259 |
| less Imports of goods and services | 3,683 | 5,214 | 11,163 | 25,530 | 47,199 | 66,948 |
| Statistical discrepancy(a) | -386 | -459 | -801 | -2,023 | -3,458 | 1,283 |
| Gross domestic product | 23,164 | 38,345 | 79,526 | 145,900 | 248,566 | 397,885 |
| Compensation of employees | 11,329 | 19,320 | 43,919 | 75,044 | 123,434 | 192,723 |
| Gross operating surplus | 5,096 | 9,175 | 17,299 | 36,169 | 68,337 | 118,690 |
| Gross mixed income | 4,638 | 6,343 | 10,704 | 19,904 | 28,738 | 42,545 |
| Total factor income | 21,063 | 34,838 | 71,922 | 131,117 | 220,509 | 353,958 |
| Taxes less subsidies on production and imports | 2,079 | 3,151 | 7,895 | 14,753 | 27,805 | 43,407 |
| Statistical discrepancy(b) | 22 | 356 | -291 | 30 | 252 | 520 |
| Gross domestic product | 23,164 | 38,345 | 79,526 | 145,900 | 248,566 | 397,885 |
|
(a) Expenditure-based.
(b) Income-based.
Source: Australian System of National Accounts, 2002-03 (5204.0). |
29.7 GDP ACCOUNT, Current prices
|
| | 1995-96 | 1996-97 | 1997-98 | 1998-99 | 1999-2000 | 2000-01 | 2001-02 | 2002-03 |
| | $m | $m | $m | $m | $m | $m | $m | $m |
|
| Final consumption expenditure | | | | | | | | |
| General government | 92,956 | 96,173 | 101,332 | 108,266 | 113,305 | 120,390 | 127,413 | 134,311 |
| Households | 301,069 | 314,565 | 335,102 | 354,420 | 374,922 | 404,271 | 426,154 | 452,629 |
| Total final consumption expenditure | 394,025 | 410,738 | 436,434 | 462,686 | 488,226 | 524,661 | 553,567 | 586,940 |
| Gross fixed capital formation | | | | | | | | |
| Private | 88,029 | 95,040 | 108,722 | 113,721 | 125,711 | 120,623 | 134,452 | 157,703 |
| Public | 23,571 | 22,550 | 20,748 | 25,278 | 24,898 | 24,678 | 26,448 | 28,268 |
| Total gross fixed capital formation | 111,600 | 117,588 | 129,473 | 138,999 | 150,609 | 145,301 | 160,900 | 185,971 |
| Changes in inventories | -813 | -10 | 62 | 4,662 | 1,791 | 510 | 1,136 | 445 |
| Gross national expenditure | 504,812 | 528,316 | 565,969 | 606,346 | 640,626 | 670,471 | 715,603 | 773,356 |
| Exports of goods and services | 99,095 | 105,160 | 113,744 | 112,025 | 126,222 | 153,854 | 153,340 | 148,409 |
| less Imports of goods and services | 101,078 | 103,590 | 118,482 | 126,456 | 140,811 | 153,205 | 154,573 | 167,093 |
| Statistical discrepancy(a) | - | - | - | - | - | - | - | -1,420 |
| Gross domestic product | 502,828 | 529,886 | 561,229 | 591,917 | 626,037 | 671,120 | 714,370 | 753,252 |
| Compensation of employees | 241,100 | 257,968 | 268,912 | 286,610 | 302,116 | 321,024 | 337,657 | 360,012 |
| Gross operating surplus | 153,623 | 162,189 | 177,700 | 183,069 | 196,422 | 210,279 | 225,766 | 240,334 |
| Gross mixed income | 49,064 | 47,969 | 50,062 | 52,396 | 54,272 | 57,522 | 65,365 | 61,683 |
| Total factor income | 443,787 | 468,126 | 496,674 | 522,075 | 552,810 | 588,825 | 628,788 | 662,029 |
| Taxes less subsidies on production and imports | 59,041 | 61,760 | 64,555 | 69,842 | 73,227 | 82,295 | 85,582 | 92,474 |
| Statistical discrepancy(b) | - | - | - | - | - | - | - | -1,251 |
| Gross domestic product | 502,828 | 529,886 | 561,229 | 591,917 | 626,037 | 671,120 | 714,370 | 753,252 |
|
(a) Expenditure-based.
(b) Income-based.
Source: Australian System of National Accounts, 2002-03 (5204.0). |
29.8 EXPENDITURE ON GDP, Chain volume measures(a)
|
| | 1995-96 | 1996-97 | 1997-98 | 1998-99 | 1999-2000 | 2000-01 | 2001-02 | 2002-03 |
| | $m | $m | $m | $m | $m | $m | $m | $m |
|
| Final consumption expenditure | | | | | | | | |
| General government | 108,468 | 110,031 | 114,186 | 118,808 | 122,278 | 124,769 | 127,413 | 130,616 |
| Households | 341,003 | 350,892 | 367,713 | 385,440 | 401,059 | 412,726 | 426,154 | 443,168 |
| Total final consumption expenditure | 449,374 | 460,858 | 481,852 | 504,218 | 523,315 | 537,479 | 553,567 | 573,784 |
| Gross fixed capital formation | | | | | | | | |
| Private | 92,976 | 102,700 | 116,625 | 120,731 | 133,083 | 122,189 | 134,452 | 155,965 |
| Public | 23,720 | 23,132 | 21,231 | 25,473 | 25,252 | 24,712 | 26,448 | 28,187 |
| Total gross fixed capital formation | 114,017 | 123,050 | 135,087 | 144,366 | 156,052 | 146,076 | 160,899 | 184,149 |
| Domestic final demand | 565,572 | 586,478 | 619,494 | 650,426 | 681,730 | 684,307 | 714,467 | 757,936 |
| Changes in inventories | -255 | -821 | -28 | 5,397 | 3,721 | 1,210 | 1,136 | 520 |
| Gross national expenditure | 562,312 | 583,144 | 616,018 | 652,186 | 682,062 | 683,923 | 715,603 | 758,456 |
| Exports of goods and services | 112,701 | 124,514 | 129,113 | 131,743 | 144,373 | 154,975 | 153,340 | 152,435 |
| less Imports of goods and services | 107,311 | 117,967 | 129,436 | 135,685 | 153,126 | 151,191 | 154,573 | 175,319 |
| Statistical discrepancy(b) | - | - | - | - | - | - | - | -1,363 |
| Gross domestic product | 569,125 | 590,471 | 616,805 | 649,550 | 673,944 | 687,720 | 714,370 | 734,209 |
|
(a) Reference year is 2001-02.
(b) Expenditure-based.
Source: Australian System of National Accounts, 2002-03 (5204.0). |
The GDP account can also be used to show changes in the share of income accruing to labour (i.e. compensation of employees) compared with the share accruing to capital (i.e. profits, defined as the gross operating surplus of non-financial and financial corporations). Graphs 29.9 and 29.10 show how the shares of total factor income accruing to wages and to profits have changed since 1966-67. (Total factor income is equal to the sum of compensation of employees, gross operating surplus and gross mixed income.)
The highest recorded value of the wages share of total factor income was 61.5% in 1974-75. The wages share has recovered somewhat from its low value of 52.8% in 1988-89, but at 54.4% for 2002-03 it remains below the level recorded for most of the 1970s and early-1980s. In 2002-03 the profits share of total factor income of 25.0% for private and public corporations is the highest recorded value.
National income account
The national income account shows the sources of national income and how much of this income is spent on final consumption. That part of income which is not spent in this way is saving. Tables 29.11 and 29.12 show the income account for a number of years between 1965-66 and 2002-03 - table 29.11 shows a series of snapshots at five-yearly intervals to 1990-91, while table 29.12 shows annual time series from 1995-96 to 2002-03.
29.11 NATIONAL INCOME ACCOUNT, Current prices - Five-yearly intervals
|
| | 1965-66 | 1970-71 | 1975-76 | 1980-81 | 1985-86 | 1990-91 |
| | $m | $m | $m | $m | $m | $m |
|
INCOME |
|
| Compensation of Employees | 11,329 | 19,320 | 43,919 | 75,044 | 123,434 | 192,723 |
| Gross operating surplus | 5,096 | 9,175 | 17,299 | 36,169 | 68,337 | 118,690 |
| Gross mixed income | 4,638 | 6,343 | 10,704 | 19,904 | 28,738 | 42,545 |
| Taxes less subsidies on production and imports | 2,079 | 3,151 | 7,895 | 14,753 | 27,805 | 43,407 |
| Net primary income from non-residents | -308 | -600 | -1,202 | -2,397 | -6,853 | -17,224 |
| Gross national income | 22,834 | 37,389 | 78,615 | 143,473 | 241,461 | 380,141 |
| Net secondary income from non-residents | -90 | -110 | -287 | -441 | -384 | 453 |
| Gross disposable income | 22,744 | 37,279 | 78,328 | 143,032 | 241,077 | 380,594 |
|
USE OF DISPOSABLE INCOME |
|
| Final consumption expenditure | | | | | | |
| General government | 3,146 | 5,547 | 14,715 | 27,123 | 49,760 | 74,663 |
| Households | 13,746 | 21,515 | 45,459 | 84,097 | 144,502 | 233,726 |
| Total final consumption expenditure | 16,892 | 27,062 | 60,175 | 111,220 | 194,263 | 308,390 |
| Net saving(a) | 1,917 | 3,751 | 5,980 | 9,690 | 7,379 | 7,826 |
| Consumption of fixed capital | 3,933 | 6,466 | 12,169 | 22,134 | 39,435 | 64,378 |
| Total use of gross disposable income | 22,744 | 37,279 | 78,328 | 143,032 | 241,077 | 380,594 |
|
(a) Net saving is derived as a balancing item.
Source: Australian System of National Accounts, 2002-03 (5204.0) |
29.12 NATIONAL INCOME ACCOUNT, Current prices
|
| | 1995-96 | 1996-97 | 1997-98 | 1998-99 | 1999-00 | 2000-01 | 2001-02 | 2002-03 |
| | $m | $m | $m | $m | $m | $m | $m | $m |
|
INCOME |
|
| Compensation of Employees | 241,100 | 257,968 | 268,912 | 286,610 | 302,116 | 321,024 | 337,657 | 360,012 |
| Gross operating surplus | 153,623 | 162,189 | 177,700 | 183,069 | 196,422 | 210,279 | 225,766 | 240,334 |
| Gross mixed income | 49,064 | 47,969 | 50,062 | 52,396 | 54,272 | 57,522 | 65,365 | 61,683 |
| Taxes less subsidies on production and imports | 59,041 | 61,760 | 64,555 | 69,842 | 73,227 | 82,295 | 85,582 | 92,474 |
| Net primary income from non-residents | -19,533 | -19,151 | -18,091 | -18,430 | -18,249 | -19,241 | -20,273 | -22,555 |
| Gross national income | 483,295 | 510,735 | 543,138 | 573,487 | 607,788 | 651,879 | 694,097 | 731,948 |
| Net secondary income from non-residents | 64 | -21 | 22 | -749 | 218 | 32 | -17 | -220 |
| Gross disposable income | 483,359 | 510,714 | 543,160 | 572,738 | 608,006 | 651,911 | 694,080 | 731,728 |
|
USE OF DISPOSABLE INCOME |
|
| Final consumption expenditure | | | | | | | | |
| General government | 92,956 | 96,173 | 101,332 | 108,266 | 113,305 | 120,390 | 127,413 | 134,311 |
| Households | 301,069 | 314,565 | 335,102 | 354,420 | 374,922 | 404,271 | 426,154 | 452,629 |
| Total final consumption expenditure | 394,025 | 410,738 | 436,434 | 462,686 | 488,226 | 524,661 | 553,567 | 586,940 |
| Net saving(a) | 10,750 | 19,646 | 20,654 | 18,837 | 21,705 | 20,925 | 25,724 | 23,178 |
| Consumption of fixed capital | 78,584 | 80,330 | 86,072 | 91,215 | 98,075 | 106,325 | 114,789 | 121,610 |
| Total use of gross disposable income | 483,359 | 510,714 | 543,160 | 572,738 | 608,006 | 651,911 | 694,080 | 731,728 |
|
(a) Net saving is derived as a balancing item.
Source: Australian System of National Accounts, 2002-03 (5204.0). |
Graph 29.13 shows net saving by institutional sector as a proportion of GDP for the years 1966-67 to 2002-03. Household net saving as a percentage of GDP generally rose between 1966-67 and 1974-75, but has fallen subsequently from its high of 11.1% in 1974-75 to a position in 2002-03 where, for the first time, consumption by households exceeded income and, consequently, household net saving was negative (-$11.0b) (table 29.15). General government net saving was negative from 1975-76 to 1996-97 (except for 1988-89 and 1989-90). In 2002-03 it was positive at 1.8% ($13.3b). In 2002-03 net saving of non-financial corporations was 1.2% of GDP ($8.9b). Net saving of financial corporations was negative from 1982-83 to 1986-87, the only period for which this sector has recorded negative net saving. In 2002-03 net saving of financial corporations was 1.6% of GDP ($11.9b).
National capital account
The national capital account shows how the saving from the national income account and consumption of fixed capital (depreciation) are used to finance gross fixed capital formation. If, as is currently the case for Australia, the nation's saving and consumption of fixed capital are not sufficient to pay for all the fixed capital needed for Australian production, the shortfall must be borrowed from overseas. The amount borrowed from overseas is shown in the national capital account as a negative entry for net lending to non-residents.
Tables 29.14 and 29.15 show the national capital account for a number of years between 1965-66 and 2002-03 - table 29.14 shows a series of snapshots at five-yearly intervals to 1990-91, while table 29.15 shows annual time series from 1995-96 to 2002-03.
29.14 NATIONAL CAPITAL ACCOUNT, Current prices - Five-yearly intervals
|
| | 1965-66 | 1970-71 | 1975-76 | 1980-81 | 1985-86 | 1990-91 |
| | $m | $m | $m | $m | $m | $m |
|
| Net saving | | | | | | |
| Non-financial corporations | 259 | 319 | -1,629 | 100 | 1,427 | -9,324 |
| Financial corporations | 131 | 278 | 733 | 308 | -1,868 | 4,592 |
| General government | 267 | 551 | -751 | -3,174 | -9,153 | -6,387 |
| Households | 1,260 | 2,603 | 7,628 | 12,456 | 16,974 | 18,946 |
| Total net saving | 1,917 | 3,751 | 5,980 | 9,690 | 7,379 | 7,826 |
| Consumption of fixed capital | 3,933 | 6,466 | 12,169 | 22,134 | 39,435 | 64,378 |
| Net capital transfers receivable from non-residents | 46 | 56 | -27 | 167 | 830 | 2,071 |
| Gross saving and capital transfers | 6,250 | 10,908 | 18,861 | 32,343 | 47,301 | 74,276 |
| Gross fixed capital formation | | | | | | |
| Private | 5,082 | 8,388 | 13,328 | 29,256 | 45,959 | 67,027 |
| Public corporations | 951 | 1,371 | 2,790 | 5,584 | 10,664 | 12,271 |
| General government | 1,089 | 1,525 | 3,792 | 4,342 | 8,518 | 10,967 |
| Total gross fixed capital formation | 7,122 | 11,284 | 19,910 | 39,182 | 65,141 | 90,267 |
| Changes in inventories | | | | | | |
| Private non-farm | 147 | 366 | 91 | 115 | 882 | -1,125 |
| Farm and public authorities | -63 | 220 | 89 | 331 | -12 | -241 |
| Total changes in inventories | 84 | 586 | 180 | 446 | 870 | -1,366 |
| Acquisitions less disposals of non-produced non-financial assets | - | - | - | - | - | -7 |
| Statistical discrepancy(a) | -409 | -815 | -510 | -2,053 | -3,710 | 763 |
| Net lending to non-residents | -899 | -782 | -1,454 | -5,597 | -14,658 | -15,382 |
| Total capital accumulation and net lending | 6,250 | 10,908 | 18,861 | 32,343 | 47,301 | 74,276 |
|
(a) Expenditure-based discrepancy less income-based discrepancy.
Source: Australian System of National Accounts, 2002-03 (5204.0). |
29.15 NATIONAL CAPITAL ACCOUNT, Current prices
|
| | 1995-96 | 1996-97 | 1997-98 | 1998-99 | 1999-00 | 2000-01 | 2001-02 | 2002-03 |
| | $m | $m | $m | $m | $m | $m | $m | $m |
|
| Net saving | | | | | | | | |
| Non-financial corporations | 4,125 | 1,994 | 4,253 | -721 | -6,928 | -4,417 | 10,505 | 8,917 |
| Financial corporations | 3,073 | 2,076 | 4,234 | 679 | 4,892 | 9,414 | 6,556 | 11,946 |
| General government | -11,738 | -2,996 | 4,082 | 10,333 | 17,367 | 1,916 | 3,110 | 13,324 |
| Households | 15,290 | 18,572 | 8,085 | 8,546 | 6,373 | 14,012 | 5,553 | -11,009 |
| Total net saving | 10,750 | 19,646 | 20,654 | 18,837 | 21,705 | 20,925 | 25,724 | 23,178 |
| Consumption of fixed capital | 78,584 | 80,330 | 86,072 | 91,215 | 98,075 | 106,325 | 114,789 | 121,610 |
| Net capital transfers receivable from non-residents | 1,045 | 1,323 | 1,097 | 1,186 | 1,136 | 1,182 | 1,186 | 1,431 |
| Gross saving and capital transfers | 90,379 | 101,299 | 107,823 | 111,237 | 120,915 | 128,433 | 141,699 | 146,219 |
| Gross fixed capital formation | | | | | | | | |
| Private | 88,029 | 95,040 | 108,722 | 113,721 | 125,711 | 120,623 | 134,452 | 157,703 |
| Public corporations | 11,322 | 9,525 | 8,013 | 11,621 | 9,018 | 8,600 | 10,020 | 10,702 |
| General government | 12,249 | 13,025 | 12,735 | 13,658 | 15,879 | 16,078 | 16,429 | 17,566 |
| Total gross fixed capital formation | 111,600 | 117,588 | 129,473 | 138,999 | 150,609 | 145,301 | 160,900 | 185,971 |
| Changes in inventories | | | | | | | | |
| Private non-farm | -487 | 2,402 | -418 | 4,675 | 1,864 | 1,047 | 910 | 1,241 |
| Farm and public authorities | -326 | -2,412 | 480 | -13 | -73 | -537 | 226 | -796 |
| Total changes in inventories | -813 | -10 | 62 | 4,662 | 1,791 | 510 | 1,136 | 445 |
| Acquisitions less disposals of non-produced non-financial assets | -25 | 6 | -30 | 19 | 83 | 73 | 170 | 133 |
| Statistical discrepancy(a) | - | - | - | - | - | - | - | -169 |
| Net lending to non-residents | -20,382 | -16,285 | -21,680 | -32,443 | -31,567 | -17,451 | -20,507 | -40,161 |
| Total capital accumulation and net lending | 90,379 | 101,299 | 107,823 | 111,237 | 120,915 | 128,433 | 141,699 | 146,219 |
|
(a) Expenditure-based discrepancy less income-based discrepancy.
Source: Australian System of National Accounts, 2002-03 (5204.0). |
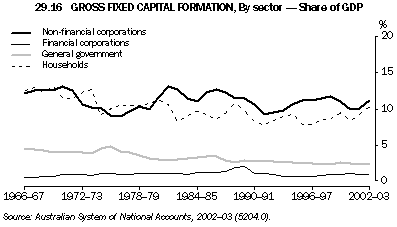
Graph 29.16 shows gross fixed capital formation (investment) by institutional sector as a proportion of GDP. For non-financial corporations this proportion generally fell during the 1970s, then rose to a peak of 13.1% in 1981-82. It has subsequently been above 10% except for the years 1991-92 to 1993-94, and in 2000-01. In 2002-03 investment by non-financial corporations was 11.2% of GDP. Household investment has generally remained at around 9% of GDP but rose sharply in 2002-03 to 10.3%. General government investment as a proportion of GDP peaked at 4.8% in 1975-76. It has generally fallen since and was 2.3% of GDP in 2002-03. Financial corporations investment peaked in 1989-90 at 1.9% of GDP, and was 0.9% of GDP in 2002-03.
29.18 EXTERNAL ACCOUNT, Current Prices - Five-yearly intervals
|
| | 1965-66 | 1970-71 | 1975-76 | 1980-81 | 1985-86 | 1990-91 |
| | $m | $m | $m | $m | $m | $m |
|
| Imports of goods and services | 3,683 | 5,214 | 11,163 | 25,530 | 47,199 | 66,948 |
| Primary income receivable | | | | | | |
| Compensation of employees | 11 | 17 | 44 | 110 | 164 | 429 |
| Property income | 400 | 760 | 1,587 | 3,147 | 8,879 | 20,552 |
| Total primary income receivable | 411 | 777 | 1,631 | 3,257 | 9,043 | 20,981 |
| Secondary Income | 169 | 358 | 773 | 1,264 | 1,797 | 2,422 |
| Capital transfers to non-residents | 40 | 78 | 203 | 320 | 486 | 653 |
| Acquisitions less disposals of non-produced non-financial assets | - | - | - | - | - | -7 |
| Net lending | -899 | -782 | -1,454 | -5,597 | -14,658 | -15,382 |
| Resources provided by non-residents | 3,404 | 5,645 | 12,316 | 24,774 | 43,867 | 75,615 |
| Exports of goods and services | 3,136 | 5,086 | 11,225 | 22,604 | 38,948 | 66,259 |
| Primary income payable | | | | | | |
| Compensation of employees | 10 | 13 | 59 | 119 | 165 | 432 |
| Property income | 93 | 164 | 370 | 741 | 2,025 | 3,325 |
| Total primary income payable | 103 | 177 | 429 | 860 | 2,190 | 3,757 |
| Secondary income payable | 79 | 248 | 486 | 823 | 1,413 | 2,875 |
| Capital transfers from non-residents | 86 | 134 | 176 | 487 | 1,316 | 2,724 |
| Resources provided to non-residents | 3,404 | 5,645 | 12,316 | 24,774 | 43,867 | 75,615 |
|
| Source: Australian System of National Accounts, 2002-03 (5204.0). |
29.19 EXTERNAL ACCOUNT, Current prices
|
| | 1995-96 | 1996-97 | 1997-98 | 1998-99 | 1999-00 | 2000-01 | 2001-02 | 2002-03 |
| | $m | $m | $m | $m | $m | $m | $m | $m |
|
| Imports of goods and services | 101,078 | 103,590 | 118,482 | 126,456 | 140,811 | 153,205 | 154,573 | 167,093 |
| Primary income receivable | | | | | | | | |
| Compensation of employees | 458 | 539 | 792 | 854 | 963 | 1,065 | 1,054 | 877 |
| Property income | 26,215 | 27,175 | 27,683 | 27,864 | 31,055 | 34,379 | 34,366 | 35,772 |
| Total primary income receivable | 26,673 | 27,714 | 28,475 | 28,718 | 32,018 | 35,444 | 35,420 | 36,649 |
| Secondary Income | 3,228 | 3,561 | 3,971 | 5,247 | 4,407 | 4,421 | 4,297 | 4,453 |
| Capital transfers to non-residents | 907 | 877 | 971 | 1,011 | 1,199 | 1,260 | 1,357 | 1,293 |
| Acquisitions less disposals of non-produced non-financial assets | -25 | 6 | -30 | 19 | 83 | 73 | 170 | 133 |
| Net lending | -20,382 | -16,285 | -21,680 | -32,443 | -31,567 | -17,451 | -20,507 | -40,161 |
| Resources provided by non-residents | 111,479 | 119,463 | 130,189 | 129,008 | 146,763 | 176,609 | 174,260 | 168,320 |
| Exports of goods and services | 99,095 | 105,160 | 113,744 | 112,025 | 126,222 | 153,854 | 153,340 | 148,409 |
| Primary income payable | | | | | | | | |
| Compensation of employees | 610 | 678 | 747 | 797 | 826 | 896 | 878 | 897 |
| Property income | 6,530 | 7,885 | 9,637 | 9,491 | 12,943 | 15,307 | 14,269 | 13,197 |
| Total primary income payable | 7,140 | 8,563 | 10,384 | 10,288 | 13,769 | 16,203 | 15,147 | 14,094 |
| Secondary income payable | 3,292 | 3,540 | 3,993 | 4,498 | 4,625 | 4,453 | 4,280 | 4,233 |
| Capital transfers from non-residents | 1,952 | 2,200 | 2,068 | 2,197 | 2,335 | 2,442 | 2,543 | 2,724 |
| Resources provided to non-residents | 111,479 | 119,463 | 130,189 | 129,008 | 146,763 | 176,609 | 174,260 | 168,320 |
|
| Source: Australian System of National Accounts, 2002-03 (5204.0). |
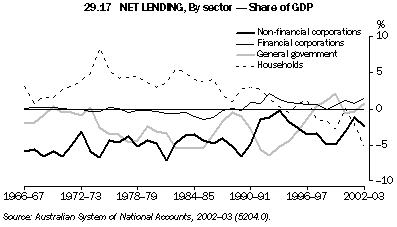
Australia has generally been a net borrower of funds from overseas. In the national accounts, this situation is reflected by a negative value for net lending to non-residents. The only exception to this pattern was in 1972-73 when Australia was a net lender to non-residents. Net borrowing from non-residents (i.e. negative net lending to non-residents), expressed as a proportion of GDP, increased significantly during the early-1980s and has remained at relatively high levels since then. Graph 29.20 shows net lending to non-residents as a proportion of GDP since 1966-67.
The importance of foreign trade to the Australian economy is illustrated by graph 29.21, which shows the ratios of exports and imports of goods and services to GDP for the financial years 1966-67 to 2002-03. In 2002-03 the import ratio was 22.2% and the export ratio was 19.7%.
|
 Print Page