SPORTS PARTICIPATION AND ATTENDANCE
Sports participation
The data presented in this section refer to persons aged 15 years and over who participated in sport and physical recreation activities as a player, competitor or general participant. People who were involved as coaches, umpires or club officials are excluded from the data.
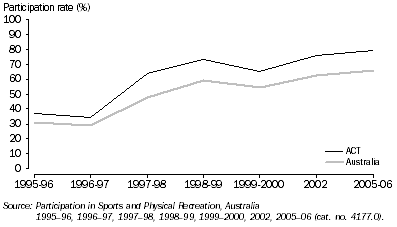
In the 12 months prior to the 2005-06 MPHS, ACT residents recorded higher participation rates in sport and physical recreation activities (80%) than any other state or territory, 14 percentage points above the national participation rate (66%).
13.8 Participants, Sports and physical recreation
- ACT and Australia
- 1995-2006

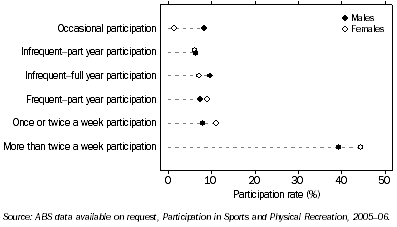
ACT Females were more likely than ACT males to have participated in sport and physical recreation activities more than twice a week (44%, compared with 39%). There were also 24,300 ACT residents participating one or twice a week (representing 12% of participants and 10% of the population aged 15 years and over. The lowest participation rates for ACT residents were for females participating occasionally (2%).
13.9 Participants in sports and physical recreation, By regularity of participation and sex
- ACT
- 2005-06

ACT males and females recorded the same overall participation rates in sports and physical recreation activities (each 80%). ACT residents aged 55-64 years recorded the highest participation rates (82%), while those aged 18-24 years recorded the lowest (76%). Nationally the highest rates of participation in sport and physical recreation activities were for persons aged 25-34 years (75%).
The most common forms of sport or physical recreation recorded by ACT residents were Walking for exercise (36%), Aerobics/fitness (18%) and Cycling (12%).
Sports attendance
The data presented in this section refer to persons aged 15 years and over who attended at least one sporting event as spectators (excluding junior school sport) during the 12 months prior to the 2005-06 MPHS.
During this period, 48% of ACT residents attended at least one sporting event. ACT males recorded higher attendance rates than ACT females (60% compared with 36%). Attendance rates were highest for ACT residents aged 15-17 years (60%), and lowest for residents aged 65 years and over (25%).
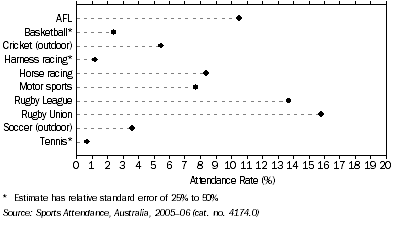
The sports events with the three highest attendance rates for ACT residents were Rugby Union (16%), Rugby League (14%) and Australian Rules football (11%).
13.10 Attendees at Main Sports, ACT
- 2005-06

The following three paragraphs contain data from the official websites of each football code and the football clubs directly. It can not be compared with data from the 2005-06 MPHS shown in preceding paragraphs as the MPHS does not include attendees or participants under 15 years of age.
Rugby Union
In 2006, 9,600 persons held Brumbies memberships. The Brumbies played seven 'home' games in the ACT during this year, with total crowd numbers of 124,816 for these seven games.
Rugby League
In 2006, the Canberra Raiders played 12 'home' games within the ACT, with a total of 138,270 persons attending these games. Almost three-quarters (74%, or 102,048) of all tickets for these home games were purchased by Raiders members. There were 8504 Raiders members in 2006.
Australian Rules Football (AFL)
The North Melbourne or Kangaroos Football Club played three 'home' games in the ACT in 2006, with total crowd numbers of 34,024 for these three games.