NATIONAL INCOME, EXPENDITURE AND PRODUCT ACCOUNTS
The Australian national income, expenditure and product accounts are compiled and published each quarter, in Australian National Accounts: National Income, Expenditure and Product (5206.0), and in greater detail once a year, in Australian System of National Accounts (5204.0).
GDP account
The GDP account indicates changes in Australian economic activity over time. Table 30.3 shows annual time series from 2001-02 to 2005-06. Table 30.4 shows expenditure on GDP in volume terms.
30.3 GDP ACCOUNT, Current prices |
|  |
 |  | 2001-02 | 2002-03 | 2003-04 | 2004-05 | 2005-06 |  |
 |  | $m | $m | $m | $m | $m |  |
|  |
| Final consumption expenditure |  |  |  |  |  |  |
 | Total general government | 132 230 | 141 088 | 150 227 | 162 837 | 176 240 |  |
 | Households | 433 649 | 461 031 | 492 315 | 520 982 | 547 138 |  |
 | Total final consumption expenditure | 565 879 | 602 119 | 642 542 | 683 819 | 723 378 |  |
| Gross fixed capital formation |  |  |  |  |  |  |
 | Private | 141 153 | 165 592 | 182 658 | 196 638 | 218 261 |  |
 | Public | 27 679 | 28 488 | 30 481 | 34 233 | 37 935 |  |
 | Total gross fixed capital formation | 168 832 | 194 080 | 213 140 | 230 871 | 256 196 |  |
| Total changes in inventories | -25 | 1 419 | 6 111 | 4 501 | 1 513 |  |
| Gross national expenditure | 734 687 | 797 619 | 861 793 | 919 191 | 981 087 |  |
| Exports of goods and services | 156 102 | 151 790 | 147 205 | 167 562 | 196 117 |  |
| less Imports of goods and services | 155 078 | 167 736 | 168 714 | 190 188 | 210 486 |  |
| Statistical discrepancy(a) | - | - | - | - | -749 |  |
| Gross domestic product | 735 714 | 781 675 | 840 285 | 896 568 | 965 969 |  |
| Compensation of employees | 356 095 | 375 509 | 399 334 | 428 549 | 460 318 |  |
| Gross operating surplus | 226 582 | 243 704 | 263 896 | 285 992 | 316 160 |  |
| Gross mixed income | 68 835 | 69 700 | 77 750 | 80 049 | 82 096 |  |
| Total factor income | 651 512 | 688 913 | 740 980 | 794 590 | 858 574 |  |
| Taxes less subsidies on production and imports | 84 202 | 92 761 | 99 305 | 101 978 | 106 034 |  |
| Statistical discrepancy(b) | - | - | - | - | 1 361 |  |
| Gross domestic product | 735 714 | 781 675 | 840 285 | 896 568 | 965 969 |  |
|  |
| - nil or rounded to zero (including null cells) |
| (a) Expenditure-based. |
| (b) Income-based. |
| Source: Australian System of National Accounts (5204.0). |
In volume terms (i.e. after the effects of price change are removed from the dollar value of Australia's production) GDP recorded a growth rate of 2.8% in 2005-06. This was higher than the 2.7% recorded in the previous year.
30.4 EXPENDITURE ON GDP, Chain volume measures(a) |
|  |
 |  | 2001-02 | 2002-03 | 2003-04 | 2004-05 | 2005-06 |  |
 |  | $m | $m | $m | $m | $m |  |
|  |
| Final consumption expenditure |  |  |  |  |  |  |
 | General government | 146 210 | 150 840 | 156 783 | 162 837 | 168 049 |  |
 | Households | 458 647 | 474 389 | 499 526 | 520 982 | 534 311 |  |
 | Total final consumption expenditure | 604 778 | 625 160 | 656 296 | 683 819 | 702 360 |  |
| Gross fixed capital formation |  |  |  |  |  |  |
 | Private | 147 909 | 172 038 | 186 422 | 196 638 | 213 763 |  |
 | Public | 28 017 | 29 238 | 31 471 | 34 233 | 36 759 |  |
 | Total gross fixed capital formation | 176 022 | 201 287 | 217 903 | 230 871 | 250 522 |  |
| Domestic final demand | 780 442 | 826 442 | 874 202 | 914 690 | 952 882 |  |
| Changes in inventories | 156 | 842 | 5 765 | 4 501 | 1 893 |  |
| Gross national expenditure | 780 767 | 827 696 | 879 908 | 919 191 | 954 775 |  |
| Exports of goods and services | 159 887 | 159 183 | 162 583 | 167 562 | 171 053 |  |
| less Imports of goods and services | 132 677 | 150 025 | 169 591 | 190 188 | 203 402 |  |
| Statistical discrepancy(b) | - | - | - | - | -678 |  |
| Gross domestic product | 813 542 | 839 187 | 873 197 | 896 568 | 921 747 |  |
|  |
| - nil or rounded to zero (including null cells) |
| (a) Reference year is 2004-05. Measures for years other than 2004-05 and 2005-06 are not additive. |
| (b) Expenditure-based. |
| Source: Australian System of National Accounts (5204.0). |
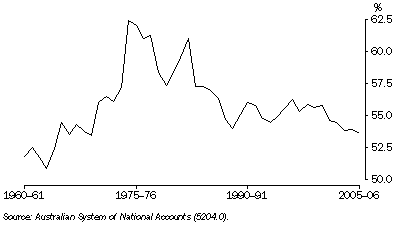
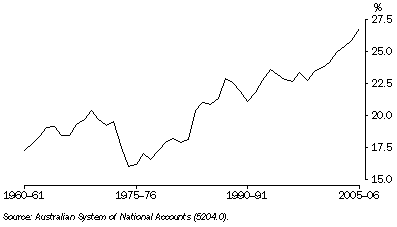
The GDP account can also be used to show changes in the share of income accruing to labour (i.e. compensation of employees) compared with the share accruing to capital (i.e. profits, defined as the gross operating surplus of non-financial and financial corporations). Graphs 30.5 and 30.6 show how the shares of total factor income accruing to wages and to profits have changed since 1960-61. (Total factor income is equal to the sum of compensation of employees, gross operating surplus and gross mixed income.)
The highest recorded value of the wages share of total factor income was 62.4% in 1974-75. The wages share in 2005-06 was 53.6%, slightly lower than the previous year (53.9%), and at its lowest level since 1969-70. The profits share of total factor income has been growing steadily since 1998-99. In 2005-06 profits share was 26.9%, the highest share recorded.
30.5 Wages share of total factor income
30.6 Profits share of total factor income
National income account
The national income account shows the sources of national income and how much of this income is spent on final consumption. That part of income which is not spent in this way is saving. Table 30.7 shows annual time series from 2001-02 to 2005-06.
30.7 NATIONAL INCOME ACCOUNT, Current prices |
|  |
 |  | 2001-02 | 2002-03 | 2003-04 | 2004-05 | 2005-06 |  |
 |  | $m | $m | $m | $m | $m |  |
Income |  |
|  |
| Compensation of employees | 356 095 | 375 509 | 399 334 | 428 549 | 460 318 |  |
| Gross operating surplus | 226 582 | 243 704 | 263 896 | 285 992 | 316 160 |  |
| Gross mixed income | 68 835 | 69 700 | 77 750 | 80 049 | 82 096 |  |
| Taxes less subsidies on production and imports | 84 202 | 92 761 | 99 305 | 101 978 | 106 034 |  |
| Net primary income from non-residents | -19 667 | -22 190 | -23 529 | -32 444 | -37 467 |  |
| Gross national income | 716 047 | 759 484 | 816 756 | 864 124 | 927 141 |  |
| Net secondary income from non-residents |  |  |  |  |  |  |
 | Current taxes on income, wealth, etc. | 1 002 | 965 | 981 | 989 | 1 001 |  |
 | Other current transfers | -1 019 | -1 179 | -1 250 | -1 409 | -1 438 |  |
| Gross disposable income | 716 030 | 759 270 | 816 487 | 863 704 | 926 704 |  |
Use of gross disposable income |  |
|  |
| Final consumption expenditure |  |  |  |  |  |  |
 | General government | 132 230 | 141 088 | 150 227 | 162 837 | 176 240 |  |
 | Households | 433 649 | 461 031 | 492 315 | 520 982 | 547 138 |  |
 | Total final consumption expenditure | 565 879 | 602 119 | 642 542 | 683 819 | 723 378 |  |
| Net saving(a) | 34 891 | 35 625 | 46 190 | 45 362 | 57 850 |  |
| Consumption of fixed capital | 115 259 | 121 526 | 127 754 | 134 523 | 145 476 |  |
| Total use of gross disposable income | 716 030 | 759 270 | 816 487 | 863 704 | 926 704 |  |
|  |
| (a) Net saving is derived as a balancing item. |
| Source: Australian System of National Accounts (5204.0). |
Graph 30.8 shows net saving by institutional sector as a proportion of GDP for the years 1960-61 to 2005-06. Household net saving as a percentage of GDP generally fluctuated between 6% and 7% between 1960-61 and 1971-72. It then rose to a peak of 11.6% in 1974-75. Since then it has fallen to a position in 2002-03 when consumption by households exceeded income and, consequently, household net saving was negative for the first time. Household net saving has remained negative since 2002-03. In 2005-06 consumption exceeded household income, by $3.8 billion (b) (table 30.9).
30.8 Net saving, relative to GDP
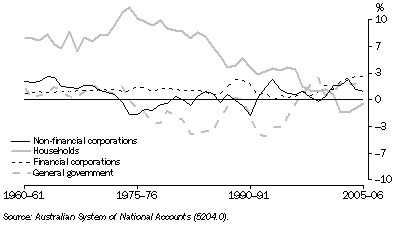
General government net saving was positive from 1960-61 to 1972-73 before turning negative from 1974-75 to 1996-97 (except for 1988-89). It has remained positive since 1997-98. In 2005-06 general government net saving was positive at 2.5% of GDP ($23.9b). In 2005-06 net saving of non-financial corporations was 1.0% of GDP ($10.0b). Net saving of financial corporations has been positive at about 1% to 2% of GDP for virtually all of its history. In 2005-06 net saving of financial corporations was 2.9% of GDP ($27.7b).
National capital account
The national capital account shows how the saving from the national income account and consumption of fixed capital (depreciation) are used to finance gross fixed capital formation. If, as is currently the case for Australia, the nation's saving and consumption of fixed capital are not sufficient to pay for all the fixed capital needed for Australian production, the shortfall must be borrowed from overseas. The amount borrowed from overseas is shown in the national capital account as a negative entry for net lending to non-residents. Table 30.9 shows the annual time series from 2001-02 to 2005-06.
30.9 NATIONAL CAPITAL ACCOUNT, Current prices |
|  |
 |  | 2001-02 | 2002-03 | 2003-04 | 2004-05 | 2005-06 |  |
 |  | $m | $m | $m | $m | $m |  |
|  |
| National net saving |  |  |  |  |  |  |
 | General government | 7 686 | 15 891 | 15 514 | 18 088 | 23 920 |  |
 | Households | 4 684 | -12 024 | -13 240 | -9 719 | -3 812 |  |
 | Non-financial corporations | 13 124 | 13 925 | 21 270 | 11 443 | 10 036 |  |
 | Financial corporations | 9 396 | 17 833 | 22 647 | 25 551 | 27 704 |  |
 | Total national net saving | 34 891 | 35 625 | 46 190 | 45 362 | 57 850 |  |
| Consumption of fixed capital | 115 259 | 121 526 | 127 754 | 134 523 | 145 476 |  |
| Capital transfers |  |  |  |  |  |  |
 | Receivable from non-residents | 2 543 | 2 404 | 2 571 | 2 674 | 2 648 |  |
 | less Payable to non-residents | 1 357 | 1 301 | 1 404 | 1 533 | 1 512 |  |
| Gross saving and capital transfers | 151 337 | 158 254 | 175 112 | 181 026 | 204 461 |  |
| Gross fixed capital formation |  |  |  |  |  |  |
 | Private | 141 153 | 165 592 | 182 658 | 196 638 | 218 261 |  |
 | Public corporations | 10 126 | 10 688 | 11 934 | 14 013 | 17 394 |  |
 | General government | 17 553 | 17 800 | 18 548 | 20 220 | 20 541 |  |
 | Total gross fixed capital formation | 168 832 | 194 080 | 213 140 | 230 871 | 256 196 |  |
| Changes in inventories |  |  |  |  |  |  |
 | Private non-farm(a) | -223 | 1 937 | 6 448 | 4 294 | 482 |  |
 | Farm | 176 | -407 | -31 | 271 | 683 |  |
 | Public authorities | 22 | -111 | -306 | -64 | 348 |  |
 | Total changes in inventories | -25 | 1 419 | 6 111 | 4 501 | 1 513 |  |
| Acquisitions less disposals of non-produced non-financial assets | 170 | 112 | 72 | -71 | 4 |  |
| Statistical discrepancy(b) | - | - | - | - | -2 110 |  |
| Net lending to non-residents | -17 644 | -37 359 | -44 212 | -54 278 | -51 141 |  |
| Total capital accumulation and net lending | 151 337 | 158 254 | 175 112 | 181 026 | 204 461 |  |
|  |
| - nil or rounded to zero (including null cells) |
| (a) Includes for all periods the privatised marketing authorities. |
| (b) Statistical discrepancy (E) less statistical discrepancy (I). |
| Source: Australian System of National Accounts (5204.0). |
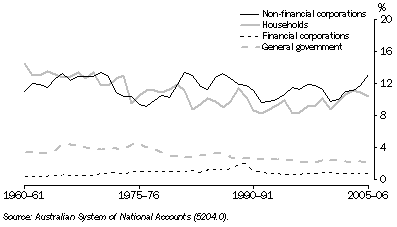
Graph 30.10 shows gross fixed capital formation (investment) by institutional sector as a proportion of GDP. Investment by non-financial corporations generally fell during the 1970s and was reasonably stable up to the 1990s. It has generally been above 10% of GDP and in 2005-06 investment by non-financial corporations was 13.2% of GDP. Household investment as a proportion of GDP declined steadily between 1960-61 and 1973-74 but has since remained steady at around 10% of GDP. In 2005-06 the ratio to GDP was 10.5%. General government investment as a proportion of GDP peaked at 4.6% in 1975-76 and has generally fallen since then. It was 2.1% of GDP in 2005-06. The highest level of Financial corporations investment, expressed as a
proportion of GDP, was recorded in 1989-90 (2.0%). It has generally fallen since and was 0.8% of GDP in 2005-06.
30.10 Investment, relative to GDP
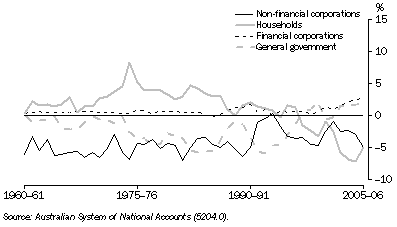
Graph 30.11 shows net lending by institutional sector as a proportion of GDP. A positive percentage for a sector indicates that it is a net lender to other sectors; a negative percentage indicates that it is a net borrower.
The household sector has been a net lender for most years. As a proportion of GDP, net lending by households peaked in 1974-75 at 8.3%. Since then it has trended downwards and the household sector changed from a net lender to a net borrower in 1997-98. In 2005-06 household net borrowing was 4.9%. Non-financial corporations have been net borrowers over the entire period 1967-68 to 2005-06 (except for 1993-94), and the amounts borrowed have fluctuated significantly from year to year. As a proportion of GDP, their net borrowing was 5.0% in 2005-06.
In 2005-06 financial corporations net lending represented 2.8% of GDP, the highest recorded level. After recording a record level of borrowing as a proportion of GDP in 1992-93 (5.9%), general government borrowing steadily declined. From 1997-98 to 1999-2000 the sector was a net lender and in 2000-01 and 2001-02 general government was a net borrower before returning to being a net lender from 2002-03 to 2005-06. In 2005-06 general government net lending represented 1.7% of GDP.
30.11 Net lending, relative to GDP
External account
The external account is derived from the detailed balance of payments current and capital accounts (see the
International accounts and trade chapter). It shows Australia's exports and imports, incomes and transfers received by Australian residents from non-residents, and incomes and transfers payable to non-residents by Australian residents. The balance on the external account is net lending to non-residents. This is the same as the balance in the national capital account. Table 30.12 shows the external account for the last five years.
30.12 EXTERNAL ACCOUNTS, Current prices |
|  |
 |  |  | 2001-02 | 2002-03 | 2003-04 | 2004-05 | 2005-06 |  |
 |  |  | $m | $m | $m | $m | $m |  |
Income account |  |
|  |
| Income of non-residents |  |  |  |  |  |  |
 | Imports of goods and services | 155 078 | 167 736 | 168 714 | 190 188 | 210 486 |  |
 | Primary income receivable |  |  |  |  |  |  |
 |  | Compensation of employees | 1 196 | 1 324 | 1 619 | 1 703 | 1 802 |  |
 |  | Property income receivable | 34 057 | 36 605 | 38 903 | 51 722 | 60 625 |  |
 |  | Total primary income receivable | 35 253 | 37 929 | 40 522 | 53 425 | 62 427 |  |
 | Secondary income receivable | 4 297 | 4 447 | 4 542 | 4 689 | 4 710 |  |
 | Total income of non-residents | 194 628 | 210 112 | 213 778 | 248 302 | 277 623 |  |
| Uses of income of non-residents |  |  |  |  |  |  |
 | Exports of goods and services | 156 102 | 151 790 | 147 205 | 167 562 | 196 117 |  |
 | Primary income payable |  |  |  |  |  |  |
 |  | Compensation of employees | 902 | 900 | 989 | 1 113 | 1 189 |  |
 |  | Property income payable | 14 684 | 14 839 | 16 004 | 19 868 | 23 771 |  |
 |  | Total primary income payable | 15 586 | 15 739 | 16 993 | 20 981 | 24 960 |  |
 | Secondary income payable | 4 280 | 4 233 | 4 273 | 4 269 | 4 273 |  |
 | Balance on external income account | 18 660 | 38 350 | 45 307 | 55 490 | 52 273 |  |
 | Total use of income of non residents | 194 628 | 210 112 | 213 778 | 248 302 | 277 623 |  |
Capital account |  |
|  |
| Balance on external income account | 18 660 | 38 350 | 45 307 | 55 490 | 52 273 |  |
| Capital transfers receivable | 1 357 | 1 301 | 1 404 | 1 533 | 1 512 |  |
| less Capital transfers payable | 2 543 | 2 404 | 2 571 | 2 674 | 2 648 |  |
| Total net capital transfers | -1 186 | -1 103 | -1 167 | -1 141 | -1 136 |  |
| Gross saving and capital transfers | 17 474 | 37 247 | 44 140 | 54 349 | 51 137 |  |
| Acquisitions less disposals of non-produced non-financial assets | -170 | -112 | -72 | 71 | -4 |  |
| Net lending (+) / net borrowing (-) | 17 644 | 37 359 | 44 212 | 54 278 | 51 141 |  |
| Total capital accumulation and net lending (+) / net borrowing (-) | 17 474 | 37 247 | 44 140 | 54 349 | 51 137 |  |
|  |
| Source: Australian System of National Accounts (5204.0). |
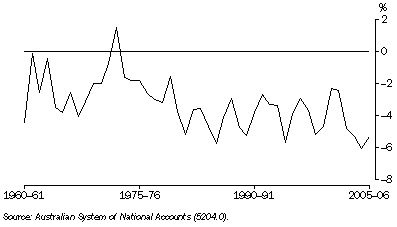
Australia has generally been a net borrower of funds from overseas. In the national accounts, this situation is reflected by a negative value for net lending to non-residents. The only exception to this pattern was in 1972-73. Net borrowing from non-residents, expressed as a proportion of GDP, increased significantly in the early-1980s and has remained at relatively high levels since then. The ratio of net borrowing from overseas to GDP in 2005-06 was 5.3%, down from 6.1% in 2004-05. Graph 30.13 shows net lending to non-residents as a proportion of GDP since 1960-61.
30.13 Net lending to overseas, relative to GDP
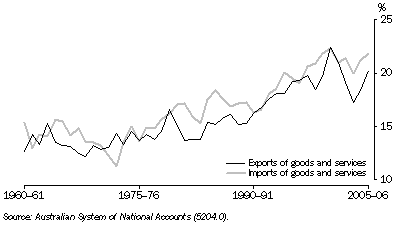
The growing importance of international trade to the Australian economy is illustrated by graph 30.14 which shows the ratios of exports and imports of goods and services to GDP in current prices since 1960-61. In 2005-06 the imports ratio was 21.8% and the exports ratio was 20.3%. Since 2000-01 imports increased 55.6% in volume terms compared with a 6.0% growth in exports.
30.14 Exports and imports, relative to GDP
 Print Page