OUTPUT
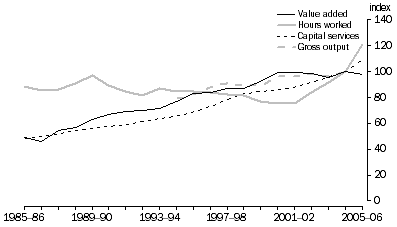
Figure 4.2 shows the growth in value added for Mining. The chart shows that between 1985-86 and 2000-01, value added in volume terms had steady upward growth. From 2000-01 though, there was no growth for value added in volume terms. Figure 4.2 also shows gross output for Mining, which shows a similar pattern to value added, although there are some minor differences.
4.2 Mining outputs and inputs, (2004-05 = 100)

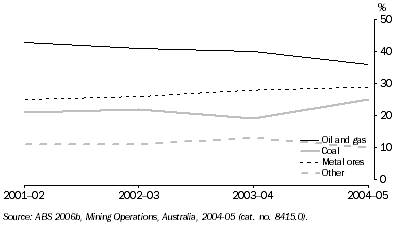
The low growth in value added since 2000-01 is associated with compositional change within the industry. While there was a decline in the output of oil and gas there was a strong increase in the production of other minerals. Figure 4.3 shows Mining subdivision shares of current price value added reflecting these compositional shifts in output.
4.3 Mining current price value added shares by subdivision

The production volumes of crude oil and condensate have been falling from around 2000-01. The main reason for this drop in volumes is due to depletion of the mature oil fields in the Gippsland basin and the Timor Sea (ABARE 2003). In addition, during 2005-06 the disruption by cyclones in the Northwest Shelf was also a contributor to the decline in oil production (ABARE 2006). The effect is significant, as oil and gas has contributed up to 43% of industry value added (ABS 2006b). However, this proportion has been falling since 2001-02, to 36% in 2004-05.
The reason that oil and gas has a significant proportion of industry value added relative to output is because of its relatively low intermediate usage. Oil and gas uses around 10% of the industry's intermediate inputs, but it generates between 25 to 30% of Mining's gross output.
One other possibility that may be constraining output growth is upstream and downstream production bottlenecks. One possible downstream constraint on output growth is port capacity. If ores cannot be exported out of the country, then mines may not extract the ore out of the ground because of limited storage facilities at ports. While intermediate products are not an output issue, the availability of replacement parts may be an upstream factor constraining output growth. For instance, large truck tyres are in short supply globally (Treasury 2005).
 Print Page
 Print All