THE STATISTICAL DISCREPANCIES
A more objective but still limited indicator of accuracy is provided by examining the differences between the conceptually equivalent, expenditure, production and income estimates of GDP. Quarterly GDP in the Australian national accounts is derived as the average of the three measures, with accounting balance being achieved by an explicit statistical discrepancy item for each of the three elements.
The three measures of GDP up to the year prior to the most recent complete year are balanced in annual terms using the supply and use approach. This process eliminates the statistical discrepancies in annual terms, except for the latest year. The quarterly estimates of GDP are benchmarked to the annual estimates, but within-year inconsistencies remain.
Large and persistent statistical discrepancies relative to GDP can indicate gaps in the coverage of components or other quality issues. Because the components are balanced annually in a supply and use table, the magnitude of the quarterly statistical discrepancies is small relative to the level of GDP and they cancel out over the year. Any significant data coverage issues have been addressed over time. Of more interest in the Australian context is that quarter to quarter changes in the level of the statistical discrepancies are associated with minor or more significant inconsistencies between the growth rate of GDP and its conceptually equivalent components. For this analysis, it is not necessary to examine the statistical discrepancies at all. The coherence of the data is best seen by examining the growth rates of the three components and GDP.
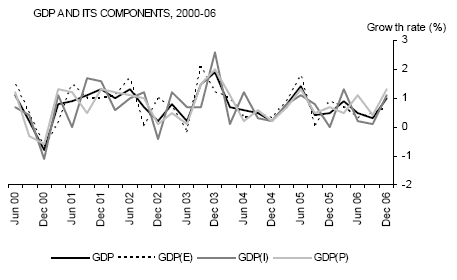
The graph below shows the quarterly growth rates of GDP and its expenditure, production and income components drawn from the December 2006 issue of the Australian national accounts. Over the 75 quarters from June quarter 1988, the expenditure, production and income components all moved in the same direction 80% of the time, but in 75% of quarters the disparity in growth rates between the strongest and the weakest growth component was greater than 0.5 percentage points, and in 90% of quarters it was greater than 0.3 percentage points. If only the two most consistent data items at each point in time are taken into account, as could be expected the coherence improves, as in only 30% of cases the difference is greater than 0.3 percentage points. The graph shows a more limited time series for reasons of legibility.

Data for recent quarters are more consistent, but this may reflect the fact that there has been less opportunity for revision of the data, especially from supply and use benchmarking. An examination of the initial estimates for each quarter shows the three GDP components to be more consistent than the revised data vintage shown below. There is a tendency for the three measures to drift as the revision process continues and this may be in part due to the procedures used to benchmark the quarterly estimates to annual data. Because of the timing uncertainties apparent in the quarterly data, users are advised to pay more attention to trend estimates and annual estimates for analysis of economic conditions, especially going back in time.
GDP, taken as the average of the three measures is a smoother series and eliminates much of this timing noise in the component data. Taking the period in the graph, GDP(P) is most highly correlated with GDP and has a correlation coefficient of 0.87. GDP(E) and GDP(I) have correlation coefficients of 0.77 and 0.78 respectively.
The timing inconsistencies are significantly reduced if six monthly rather than quarterly data are examined, as can be seen in the following graph.
 Print Page
 Print All