TRANSPORT AND STORAGE
Definition and scope
The Transport and storage industry includes all units mainly engaged in passenger or freight transport by road, rail, water or air; terminal facilities of passengers or freight; services related to transport such as car parking, stevedoring, harbour services, navigation services, airport operation or space port operation; booking, travel, freight forwarding, crating and customs agency services; and storage facilities.
ANZSIC Division I, Transport and storage, consists of seven sub-divisions:
- Road transport (sub-division 61)
- Rail transport (sub-division 62)
- Water transport (sub-division 63)
- Air and space transport (sub-division 64)
- Other transport (sub-division 65)
- Services to transport (sub-division 66)
- Storage (sub-division 67).
Summary of GSP(P) sources and methods
The methodology for Transport and storage uses an output indicator approach to compile state by industry GVA estimates. Output volumes are derived by either price deflation or quantity revaluation. These output volumes then form the basis upon which volume measures of value added are derived at the division level.
Output indicators are drawn from a number of different sources for each sub-division.
- For road freight the quantity indicator is 'tonne/kilometres' from the Survey of Motor Vehicle Use, Data Cubes, Australia (cat. no. 9210.0.55.001).
- For road passenger transport HFCE estimates are deflated by CPI components by capital city.
- For public passenger rail transport HFCE estimates are price deflated by CPI components by capital city.
- For private rail transport QBIS turnover estimates are price deflated using national level price indexes from PPI as no separate state level indexes are available.
- For water transport the quantity indicator is 'kilotonnes loaded and unloaded' from the Bureau of Transport and Regional Economics (BTRE) publication Australian Sea Freight.
- For air transport data the quantity indicator is 'passenger numbers' at major airports from the BTRE Airport Traffic publication.
- For other transport, services to transport and storage QBIS turnover estimates are price deflated using national level price indexes from PPI as no separate state level indexes are available.
For those sub-divisions that include QBIS as an indicator, the total hours worked by state for each sub-division from the
Labour Force, Australia, Detailed, Quarterly (cat. no. 6291.0.55.003) has been used to extrapolate back the state estimates prior to 2000-01.
The state output indicators for each sub-division are then summed together to produce a total for the Transport and storage industry. This total output indicator is used to derive volume measures to derive state GVA for Transport and storage.
The state volume GVAs are benchmarked to the annual national industry volume GVA.
Results for Transport and storage
Transport and storage gross value added(a), Chain volume measures(b) |
|  |
 | 2000-01 | 2001-02 | 2002-03 | 2003-04 | 2004-05 | 2005-06 |  |
Values ($m) |  |
|  |
| New South Wales | 11 556 | 11 924 | 12 544 | 12 894 | 13 498 | 13 722 |  |
| Victoria | 7 449 | 7 566 | 8 464 | 8 640 | 9 323 | 9 494 |  |
| Queensland | 6 858 | 7 325 | 7 476 | 7 932 | 8 443 | 8 738 |  |
| South Australia | 2 388 | 2 450 | 2 661 | 2 866 | 2 910 | 2 863 |  |
| Western Australia | 4 023 | 4 234 | 4 722 | 5 053 | 5 065 | 5 417 |  |
| Tasmania | 608 | 641 | 704 | 782 | 777 | 799 |  |
| Northern Territory | 410 | 404 | 396 | 426 | 478 | 503 |  |
| Australian Capital Territory | 445 | 443 | 429 | 454 | 472 | 501 |  |
| Australia | 33 717 | 34 947 | 37 385 | 39 028 | 40 966 | 42 037 |  |
Percentage changes from previous year (%) |  |
|  |
| New South Wales | 0.9 | 3.2 | 5.2 | 2.8 | 4.7 | 1.7 |  |
| Victoria | 7.6 | 1.6 | 11.9 | 2.1 | 7.9 | 1.8 |  |
| Queensland | 6.8 | 6.8 | 2.1 | 6.1 | 6.4 | 3.5 |  |
| South Australia | 2.5 | 2.6 | 8.6 | 7.7 | 1.5 | -1.6 |  |
| Western Australia | 4.7 | 5.3 | 11.5 | 7.0 | 0.2 | 6.9 |  |
| Tasmania | 7.5 | 5.4 | 9.8 | 11.2 | -0.6 | 2.8 |  |
| Northern Territory | 2.3 | -1.6 | -1.9 | 7.5 | 12.2 | 5.2 |  |
| Australian Capital Territory | 1.3 | -0.3 | -3.2 | 5.9 | 3.9 | 6.1 |  |
| Australia | 4.3 | 3.6 | 7.0 | 4.4 | 5.0 | 2.6 |  |
|  |
| (a) At basic prices. |
| (b) Reference year for chain volume measures is 2004-05. |
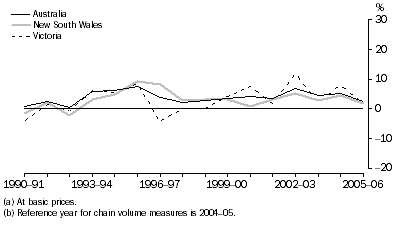
Transport and storage gross value added(a), Chain volume measures(b)-Percentage changes

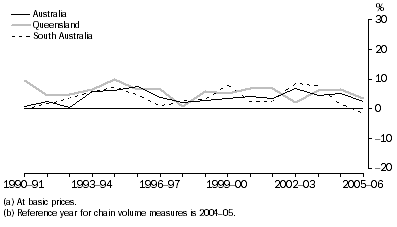
Transport and storage gross value added(a), Chain volume measures(b)-Percentage changes

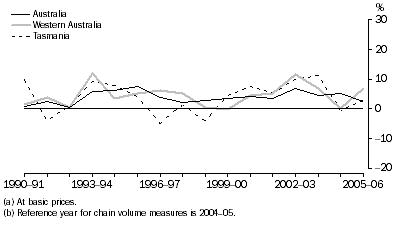
Transport and storage gross value added(a), Chain volume measures(b)-Percentage changes

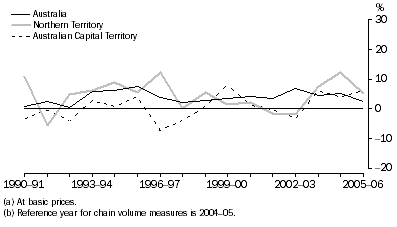
Transport and storage gross value added(a), Chain volume measures(b)-Percentage changes

Queensland has shown growth throughout the whole of the time series. Western Australia has grown in all years except 1999-2000 when there was a small fall. In 2005-06, South Australia was the only state to show negative growth of -1.6%. All other states had growth rates higher than the national rate of 2.6% except for New South Wales and Victoria.
Transport and storage gross value added, State shares - Current prices |
|  |
 | 1989-90 | 1994-95 | 1999-00 | 2003-04 | 2004-05 | 2005-06 |  |
 | % | % | % | % | % | % |  |
|  |
| New South Wales | 36.8 | 36.7 | 35.4 | 33.9 | 32.9 | 32.9 |  |
| Victoria | 23.2 | 21.9 | 23.3 | 22.2 | 22.8 | 23.5 |  |
| Queensland | 18.5 | 20.0 | 19.1 | 20.5 | 20.6 | 20.8 |  |
| South Australia | 7.0 | 7.2 | 6.1 | 6.8 | 7.1 | 6.6 |  |
| Western Australia | 10.0 | 10.0 | 12.1 | 12.5 | 12.4 | 12.3 |  |
| Tasmania | 2.1 | 1.8 | 1.6 | 1.8 | 1.9 | 1.8 |  |
| Northern Territory | 0.9 | 1.0 | 1.1 | 1.1 | 1.2 | 1.1 |  |
| Australian Capital Territory | 1.6 | 1.4 | 1.3 | 1.1 | 1.2 | 1.1 |  |
| Australia | 100.0 | 100.0 | 100.0 | 100.0 | 100.0 | 100.0 |  |
|  |
New South Wales, Victoria and Queensland together accounted for around 77% of Australian Transport and storage GVA in 2005-06. Most state shares for the Transport and storage industry have been fairly stable throughout the time series, although New South Wales lost share from 36.8% in 1989-90 to 32.9% in 2005-06, Queensland increased its share from 18.5% in 1989-90 to 20.8% in 2005-06 and Western Australia increased from 10.0% in 1989-90 to 12.3% in 2005-06.
 Print Page
 Print All