PRODUCTIVITY
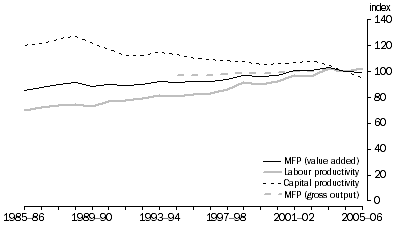
Figure 5.1 presents indexes of labour productivity, capital productivity and MFP between 1985-86 and 2005-06. Over the period 1985-86 to 2005-06, the Manufacturing industry has experienced average annual growth in value added based multifactor productivity (MFP) of about 0.7% per year (figure 5.1), although this growth has been declining in recent years. Overall, MFP in the Manufacturing industry follows a similar trend to MFP in the market sector. Labour productivity has followed a similar pattern to MFP, with growth of 1.9% per year. Capital productivity declined by 1.2% per year between 1985-86 and 2005-06.
5.1 Manufacturing MFP, labour productivity and capital productivity, (2004-05 = 100)

Figure 5.1 also shows the gross output based measure of MFP. As expected the figure shows that the growth in MFP using gross output is slower than the value added based measure of MFP.
 Print Page
 Print All