TASMANIA
In 2005-06, the Tasmanian GSP level represented almost 2% of Australian GDP.
Gross state product, Tasmania - Chain volume measures(a) |
|  |
 | 2000-01 | 2001-02 | 2002-03 | 2003-04 | 2004-05 | 2005-06 |  |
Values ($m) |  |
|  |
| GSP(A) | 14 071 | 14 620 | 15 030 | 15 667 | 16 230 | 16 668 |  |
| GSP(P) | 14 328 | 14 660 | 15 133 | 15 915 | 16 406 | 16 790 |  |
| GSP(I/E) | 13 813 | 14 580 | 14 926 | 15 418 | 16 054 | 16 546 |  |
| GDP | 784 017 | 813 542 | 839 187 | 873 197 | 896 568 | 921 747 |  |
Percentage changes from previous year (%) |  |
|  |
| GSP(A) | -1.4 | 3.9 | 2.8 | 4.2 | 3.6 | 2.7 |  |
| GSP(P) | -1.0 | 2.3 | 3.2 | 5.2 | 3.1 | 2.3 |  |
| GSP(I/E) | -1.8 | 5.6 | 2.4 | 3.3 | 4.1 | 3.1 |  |
|  |
| (a) Reference year for chain volume measures is 2004-05. |
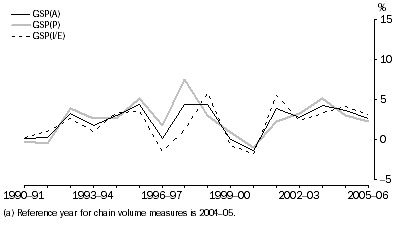
Gross State Product, Tasmania
- Chain volume measures(a)
: Percentage changes from previous year

In the last five years, growth in Tasmanian GSP(P) was between 2.3 and 5.2%. GSP(P) and GSP(I/E) growth rates generally display similar movements.
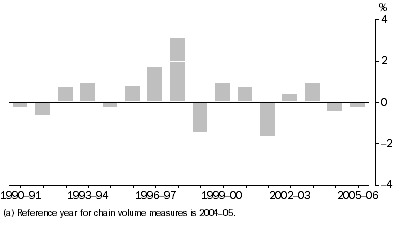
Throughout the time series, most of differences between GSP(A) and GSP(I/E) growth rates are less than 1.0 percentage point except from 1996-97 to 1998-99 and in 2001-02. The biggest difference was in 1997-98 with 3.1 percentage points difference between the two measures.
Difference between GSP(A) and GSP(I/E), Percentage changes
- Tasmania
: Chain volume measures(a)

GSP, Tasmania - Chain volume measures(a): Contribution to growth |
|  |
 | 2000-01 | 2001-02 | 2002-03 | 2003-04 | 2004-05 | 2005-06 |  |
 | % pts | % pts | % pts | % pts | % pts | % pts |  |
|  |
| Agriculture, forestry & fishing | 0.1 | 0.1 | -0.2 | 0.6 | - | 0.1 |  |
| Mining | -0.6 | - | - | 0.1 | -0.1 | -0.2 |  |
| Manufacturing | -0.9 | -0.6 | 0.3 | 0.5 | 0.5 | 0.6 |  |
| Electricity, gas & water supply | -0.1 | - | 0.1 | -0.2 | 0.3 | -0.2 |  |
| Construction | -0.4 | 0.9 | - | 0.7 | 0.2 | 0.6 |  |
| Wholesale trade | -0.4 | -0.3 | 0.3 | 0.2 | 0.2 | 0.3 |  |
| Retail trade | 0.2 | 0.2 | 0.2 | 0.6 | 0.4 | 0.4 |  |
| Accommodation, cafes & restaurants | -0.1 | -0.2 | 0.2 | 0.2 | 0.1 | - |  |
| Transport & storage | 0.3 | 0.2 | 0.4 | 0.5 | - | 0.1 |  |
| Communication services | - | 0.1 | 0.2 | 0.2 | - | 0.2 |  |
| Finance & insurance | 0.3 | 0.4 | -0.1 | -0.2 | -0.3 | 0.1 |  |
| Property & business services | 0.3 | -0.4 | - | 1.0 | 0.5 | -0.3 |  |
| Government administration & defence | -0.3 | 0.3 | 0.9 | -0.5 | 0.3 | -0.1 |  |
| Education | 0.1 | 0.1 | 0.1 | 0.2 | 0.1 | 0.1 |  |
| Health & community services | 0.2 | 0.8 | - | 0.2 | 0.2 | 0.3 |  |
| Cultural & recreational services | 0.1 | 0.1 | 0.1 | 0.1 | 0.1 | - |  |
| Personal & other services | 0.1 | 0.1 | 0.1 | 0.2 | 0.1 | - |  |
| Ownership of dwellings | 0.2 | 0.3 | 0.3 | 0.3 | 0.3 | 0.3 |  |
| Taxes less subsidies on products | -0.2 | 0.4 | 0.4 | 0.3 | 0.2 | 0.1 |  |
| Statistical discrepancy | -0.4 | 1.6 | -0.4 | -1.0 | 0.5 | 0.3 |  |
| GSP(A) | -1.4 | 3.9 | 2.8 | 4.2 | 3.6 | 2.7 |  |
|  |
| - nil or rounded to zero (including null cells) |
| (a) Reference year for chain volume measures is 2004-05. |
In 2005-06, Manufacturing and Construction (0.6 percentage points) were the main contributors to Tasmanian growth. Property and business services (-0.3 percentage points), Mining (-0.2 percentage points) and Electricity, gas and water (-0.2 percentage points) were the major detractors.
 Print Page
 Print All