CHARACTERISTICS OF ATTENDEES
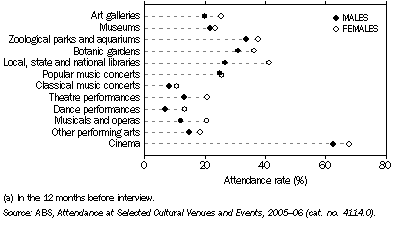
For almost all venues and events, attendance rates for females were higher than for males. The differences were most apparent for Local, state and national libraries (41% of females compared with 27% of males) and Musicals and operas (21% compared with 12%).
1.3 Persons attending selected cultural venues and events(a), By sex - 2005-06

Attendance patterns at cultural venues and events varied considerably for different age groups.
People aged 15-24 years were those most likely to attend Popular music concerts and the Cinema, while people aged 25-44 years were those most likely to visit Zoological parks and aquariums. By comparison, people aged 45-64 years were those most likely to attend Classical music concerts and Musicals and operas.
1.4 Attendance rates(a), By age - 2005-06 |
|
 | AGE GROUP (YEARS) |
 | 15-17 | 18-24 | 25-34 | 35-44 | 45-54 | 55-64 | 65-74 | 75 and
over | Total |
ATTENDANCE RATE (%) |
|
| Art galleries | 23.1 | 17.6 | 22.5 | 23.4 | 26.6 | 25.8 | 21.5 | 15.6 | 22.7 |
| Museums | 25.2 | 15.7 | 23.6 | 27.2 | 25.1 | 24.9 | 19.2 | 11.0 | 22.6 |
| Zoological parks and aquariums | 42.0 | 35.4 | 46.5 | 46.0 | 32.0 | 31.0 | 22.7 | 11.0 | 35.6 |
| Botanic gardens | 21.0 | 28.7 | 37.6 | 35.9 | 35.2 | 37.4 | 34.9 | 23.5 | 33.7 |
| Local, state and national libraries | 45.8 | 33.9 | 32.7 | 37.3 | 33.6 | 30.3 | 33.6 | 29.9 | 34.1 |
| Popular music concerts | 31.2 | 40.0 | 30.9 | 25.1 | 26.5 | 18.7 | 12.9 | 6.5 | 25.2 |
| Classical music concerts | 6.4 | 6.0 | 7.0 | 8.3 | 12.4 | 12.8 | 11.8 | 9.6 | 9.4 |
| Theatre performances | 24.5 | 15.8 | 15.4 | 15.5 | 20.3 | 20.1 | 16.8 | 7.6 | 17.0 |
| Dance performances | 18.9 | 8.2 | 9.4 | 12.3 | 12.8 | 8.5 | 6.7 | 4.3 | 10.2 |
| Musicals and operas | 18.1 | 13.7 | 13.6 | 17.0 | 19.0 | 19.9 | 16.0 | 11.5 | 16.3 |
| Other performing arts | 20.0 | 16.1 | 19.0 | 19.3 | 17.3 | 15.9 | 11.7 | 7.1 | 16.6 |
| Cinema | 93.1 | 84.5 | 75.7 | 68.6 | 62.7 | 55.6 | 44.8 | 26.7 | 65.2 |
NUMBER ('000) |
|
| Total population | 818.1 | 1 938.3 | 2 779.3 | 2 959.6 | 2 779.5 | 2 217.3 | 1 386.2 | 1 130.2 | 16 008.6 |
|
| (a) Number attending in the 12 months before interview as a percentage of the population in the relevant age group. |
| ABS, Attendance at Selected Cultural Venues and Events, 2005-06 (cat. no. 4114.0). |
 Print Page
 Print All