FEATURE ARTICLES
The following feature articles appear in detail in the publication.
LABOUR FORCE TRENDS IN WESTERN AUSTRALIA
The labour force in Western Australia has undergone considerable change over the past 20 years. Growth in the labour force has been influenced by factors such as population growth, labour force participation and economic growth. Trends such as greater participation by women, rising part-time employment, increasing casualisation and an ageing population have led to marked changes in the composition of the state's labour force. This article will examine changes in the size and composition of Western Australia's labour force and identify factors that have contributed to those changes. It will also explore changes in the geographic distribution of the labour force.
SELECTED STATISTICS FOR ABORIGINAL AND TORRES STRAIT ISLANDER PEOPLE IN WESTERN AUSTRALIA
There have been significant improvements in the range, quality and availability of statistics about Aboriginal and Torres Strait Islander Australians over the past decade. Aboriginal and Torres Strait Islander people suffer greater ill-health and are more likely to experience disability and reduced quality of life, than other Australians. They are also disadvantaged across a range of socio-economic conditions such as income, employment, educational outcomes and housing. This two-part article summarises results for Western Australia from the 2002 National Aboriginal and Torres Strait Islander Social Survey and the 2004-05 National Aboriginal and Torres Strait Islander Health Survey.
OVERVIEW
ECONOMIC SUMMARY
Growth in State Final Demand (trend chain volume measures) in Western Australia slowed to 2.7% in the March quarter 2006, from 3.0% in the previous quarter, mainly due to the impact of Tropical Cyclones Clare and Glenda on activity in the state's resources sector. In seasonally adjusted chain volume terms, the largest declines were recorded in business investment on New engineering construction (down $75 million or 4.1%) and Intangible fixed assets (down $23 million or 5.9%), as well as private investment on Alterations and additions to dwellings (down $39 million or 6.2%) during the quarter. Offsetting these decreases were increases in business investment on Machinery and equipment (up $385 million or 12.7%), and Household final consumption expenditure (up $91 million or 0.7%).
Perth's Consumer Price Index (CPI) rose by 4.2% through the year the March quarter 2006, much higher than the national increase of 3.0%. Despite national CPI growth remaining well below the rise in Perth, it has now reached the top of the Reserve Bank of Australia's (RBA) target range for inflation of 3.0%, which influenced a decision by the RBA to increase official interest rates by 25 basis points to 5.75% in May 2006.
The value of Western Australia's exports rose by 20.6% ($1,900 million) through the year to March quarter 2006, mainly in iron ore, gold and natural gas. Constraining growth were falls in exports of nickel ores and petroleum, negatively affected by cyclone activity in the state's north-west during the March quarter. The value of Western Australia's imports grew strongly through the year, rising by 39.9% ($1,379 million), mainly for gold and petroleum. The outlook for Western Australian exports remains positive for the remainder of 2006 and 2007, with economic activity forecast to grow favourably in the state's major export markets. Western Australia's largest export market, Japan, is expected to grow by 2.8% in 2006 and 2.1% in 2007, a considerable improvement after years of deflation and declining asset prices. Japan's economic growth, and in turn its demand for Western Australian exports, relies heavily on economic conditions in the United States of America which are showing signs of continued growth (3.4% in 2006 and 3.3% in 2007). Even stronger rates of growth have been forecast for other major export markets for Western Australia including China (9.5% in 2006 and 9.0% in 2007), the Republic of Korea (5.5% in 2006 and 4.5% in 2007) and India (7.3% in 2006 and 7.0% in 2007).
Western Australia's labour force continued to grow in the three months to May 2006, with the number of employed persons (trend) rising by 4,600 (0.4%), including 2,200 full-time workers. As at May 2006, there were 1,065,700 persons employed in the state's labour force, with 752,800 (70.6%) employed full-time. The number of unemployed persons (trend) in Western Australia fell strongly, down by 3,600 (8.0%) in the three months to May 2006. The sharp decline in unemployed persons in the state has seen the unemployment rate drop from 4.1% in February 2006 to a record low of 3.7% in May 2006 - well below the 5.0% rate of unemployment across the nation.
STATE ACCOUNTS
State final demand
The expansion of Western Australia's domestic economy slowed for the first time in a year, with growth in State Final Demand (trend chain volume measures) decelerating to 2.7% in the March quarter 2006, from 3.0% in the previous quarter. Despite the deceleration, growth in Western Australia (2.7%) remained well above the national average of 0.9% during the quarter and was much higher than the second ranked state or territory (Queensland) with 1.9%. The slowdown in Western Australia can partly be attributed to the impact of Tropical Cyclones Clare and Glenda on crude oil production and mining-related exports from the north-west of the state. The cyclones are also expected to have a negative effect on economic growth in the June quarter 2006.
STATE FINAL DEMAND, Chain volume measures - Change from previous quarter
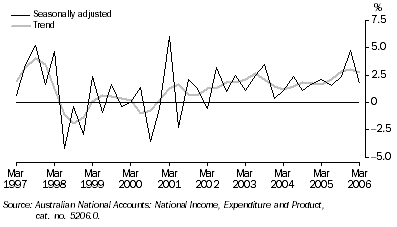
In seasonally adjusted chain volume terms, growth in Western Australia's State Final Demand slowed to 1.7% in the March quarter 2006, from a high of 4.7% in the previous quarter - a much greater deceleration than in the trend series. The deceleration was mainly attributable to lower business investment on New engineering construction (down $75 million or 4.1%) during the quarter, mainly due to decreased expenditure on a large nickel project in the state and the completion of a major power station. The decline follows very strong growth of 33.1% in the previous quarter, as a result of expansions made in alumina refining capacity. Investment on Alterations and additions to dwellings (down $39 million or 6.2%) and Intangible fixed assets (down $23 million or 5.9%) also fell during the quarter. The falls in expenditure on Intangible fixed assets were mainly in computer software, and mineral and petroleum exploration due to the impact of Tropical Cyclones Clare and Glenda. Offsetting these declines were increases in business investment on Machinery and equipment (up $385 million or 12.7%) and Household final consumption expenditure (up $91 million or 0.7%), mainly on Food and Rents and other dwelling services.
PRICES
Consumer Price Index
Perth's Consumer Price Index (CPI) rose by 1.0% in the March quarter 2006, slightly higher than the national increase of 0.9%. The main contributor to Perth's CPI growth was Housing, which increased by 1.9% during the quarter, almost entirely due to the rising costs of house purchase - including the price of new homes (excluding land) and major improvements to existing homes, as well as fixed appliances such as hot water systems, dishwashers, etc..
Other major contributors to Perth's CPI growth over the quarter were Transport (up 1.2%), Health (up 3.1%) and Education (up 6.0%). Transport prices rose mainly due to increased motor vehicle prices, as fewer incentives and bonuses were offered during the period. Health prices increased mainly due to rising pharmaceutical prices, while the increase in Education prices coincided with the commencement of the new school year. Pharmaceutical and education costs tend to rise more sharply in the first quarter of each calendar year than in other quarters.
CONSUMER PRICE INDEX (ALL GROUPS), Change from same quarter previous year

Through the year to March quarter 2006, Perth's CPI grew by 4.2%, much higher than the 3.0% growth recorded nationally. The higher result for Perth was largely due to an 8.7% increase in Housing, more than double the national average of 3.3%, largely attributable to a 15.2% increase in new house purchase prices in Perth through the year. Despite national CPI growth remaining well below the rise in Perth, it has now reached the top of the Reserve Bank of Australia's (RBA) target range for inflation of 3.0%, which influenced a decision by the RBA to increase official interest rates by 25 basis points to 5.75% in May 2006.
Wage Price Index
Western Australia's Wage Price Index of total hourly rates of pay (excluding bonuses) rose by 0.9% in the March quarter 2006, slightly higher than the 0.7% increase in the previous quarter. Despite the acceleration, wages growth in Western Australia remained below the 1.0% increase recorded nationally.
WAGE PRICE INDEX, Change from same quarter previous year
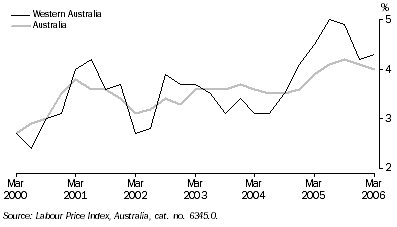
The latest quarterly increase in Western Australia's Wage Price Index has lifted the annual rate of wages growth to 4.3% through the year to March quarter 2006, from 4.2% in the previous period. This acceleration was the first since wages rose by 5.0% through the year to June quarter 2005. The main industries contributing to annual wages growth were Construction (up 6.8%) and Mining (up 6.1%), supported by the strength of activity in these industries and associated high levels of labour demand. The occupations contributing most to annual wages growth were Managers and administrators (up 5.6%), Labourers and related workers (up 5.3%) and Intermediate production and transport workers (up 5.1%), many of whom are employed in the Construction and Mining industries, as well as in Agriculture, forestry and fishing, Manufacturing and Transport and storage.
Western Australia's wages growth (4.3%) was higher than the national increase of 4.0% through the year to March quarter 2006. Wages in Australia have continued to grow above 4% per year over the last four periods, although the rate of growth has decelerated since peaking at 4.2% through the year to September quarter 2005.
CONSUMPTION
Retail trade
Growth in retail turnover accelerated in Western Australia over the three months to April 2006, increasing by 2.6% ($138 million) in trend terms, almost double the rate of growth in the previous three month period (1.4%). This acceleration comes after growth in monthly retail turnover had decelerated through much of the second half of 2005. The pick-up in retail trade can be attributed to the rebound in domestic demand and employment growth during late 2005 and early 2006. Western Australia's retail trade reflected a similar pattern to the nation's, with Australia's growth in retail turnover increasing by 2.0% in the three months to April 2006, from 1.1% in the previous period.
MONTHLY RETAIL TURNOVER, Current prices
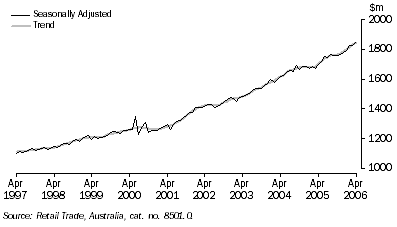
Growth in Western Australia's retail turnover was across all industry groups over the three months to April 2006, with the exception of Recreational good retailing which decreased by $14 million or 4.6%. The largest increases were recorded in Food retailing (up $46 million or 2.0%), Household good retailing (up $29 million or 3.1%) and Hospitality services retailing (up $22 million or 3.5%).
New motor vehicle sales
New motor vehicle sales (trend) in Western Australia rose for the fourth consecutive month in May 2006, increasing by 0.9% to 8,944 vehicles - the highest level of sales since the series began in January 1994. Sales of new motor vehicles in the state have generally followed an upward trend since mid-2001.
NEW MOTOR VEHICLE SALES(a)
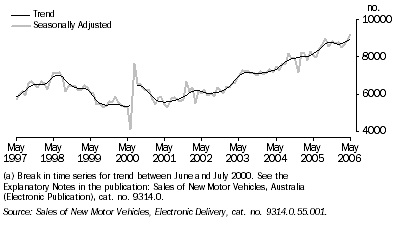
Over the three months to May 2006, sales of new motor vehicles (trend) in Western Australia rose by 1.7% (446 vehicles), compared to the previous three month period. In contrast, national new motor vehicle sales fell by 1.1%. The state increase over the period was driven mainly by sales of passenger vehicles, up 213 vehicles or 1.4%; and other vehicles (including utilities, vans, trucks and buses), up by 204 vehicles or 3.4%. Sales of sports utility vehicles also rose over the period, up by 29 vehicles or 0.6%.
INVESTMENT AND FINANCE
Private new capital expenditure
Business investment (trend chain volume measures) in Western Australia has continued to grow for seven successive quarters since mid-2004, from $2,211 million in the June quarter 2004 to a record high of $3,828 million in the March quarter 2006. Growth has been particularly strong in recent quarters, with the state recording double-digit percentage increases in business investment of 13.9% (September 2005), 15.1% (December 2005) and 10.0% (March 2006) in the last three quarters. In the March quarter 2006, private new capital expenditure rose by $347 million (10.0%), driven by increases in expenditure on both Equipment, plant and machinery (up $166 million or 9.2%) and Buildings and structures (up $144 million or 8.6%).
PRIVATE NEW CAPITAL EXPENDITURE, Chain volume measures
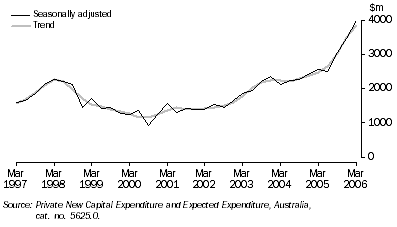
Through the year to March quarter 2006, business investment (original current prices) rose by $1,405 million (59.2%) in Western Australia. Nearly all of this growth was attributable to Mining industry investment, which almost doubled through the year, increasing by $1,214 million or 99.4%. This increase coincides with strong growth in engineering construction activity in the state's resources sector. Construction started on a number of very large resource projects in the state in the last half of 2005, including BHP Billiton's Ravensthorpe nickel project, the 5th LNG Train of the North West Shelf, Woodside's Enfield, Vincent and Laverda oil and gas project and BHP Billiton's 'Rapid Growth 2' iron ore expansion, inducing the development of infrastructure such as port upgrades, railway lines, electricity-related projects and gas pipelines.
Housing finance commitments
The number of dwellings financed (trend) in Western Australia has continued to rise for 23 consecutive months, from 6,659 in May 2004 to a record level of 9,447 in April 2006. In the last six months, growth in housing finance has accelerated rapidly, at a rate of 2.2% per month, more than four times the monthly average of 0.5% over the last 10 years.
HOUSING FINANCE COMMITMENTS, Number of dwellings financed
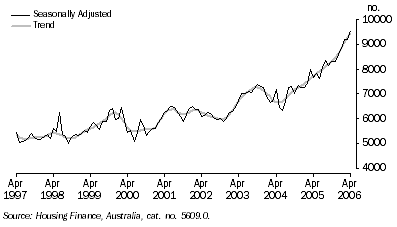
In the three months to April 2006, the number of dwellings financed (original) rose by 1,647 (6.6%) from the previous three month period. All of this rise was attributable to an increase of 1,711 (8.3%) dwellings financed by non-first home buyers, while first home buyers recorded a decrease of 64 (1.4%). Given established house prices in Perth have risen by 28.8% through the year to March quarter 2006 (eight times the national average) and average home loans have now become larger for first home buyers ($198,800) than changeover buyers ($196,000), first home buyers may have become discouraged from entering the housing market.
Contributing to a positive outlook for dwelling construction activity in the second half of 2006 has been an increase in the value of housing finance for the construction of new dwellings (original) in Western Australia, rising by $13 million (1.9%) in the three months to April 2006, entirely driven by owner occupiers (as opposed to investors).
CONSTRUCTION
Building approvals
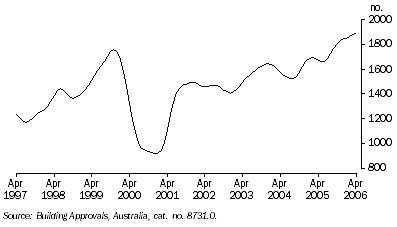
The number of dwellings approved (trend) for construction in Western Australia rose by 72 (1.1%) in the three months to April 2006, a large deceleration from the rise of 496 (8.0%) in the previous three month period. Growth in House approvals decelerated from 231 (4.4%) to 106 (1.9%) in the three months to April 2006, while Other dwelling approvals declined by 34 (2.8%) after strong growth in the previous three months of 265 (28.3%).
The deceleration in growth of building approvals in Western Australia appears to be the effect of supply-side constraints such as insufficient supply of land for development and a large and increasing backlog of work in the construction pipeline, rather than a softening in housing demand. The Housing Industry Forecasting Group of Western Australia suggests labour and materials shortages are limiting completion capacity to only 19,000 dwellings per year, less than the underlying minimum requirement of 19,600. Demand conditions for housing remain strong in the state with high levels of population, employment and wages growth being underpinned by the expanding Western Australian economy.
NUMBER OF DWELLINGS APPROVED, Houses: Trend
The value of building approved (original) for construction fell slightly in Western Australia in the three months to April 2006, down $2 million or 0.1%. The deceleration was the result of a $55 million (27.6%) decrease in the value of New other residential building approvals and a $20 million (14.3%) decline in approvals for housing renovations (i.e. alterations and additions including refurbishments and conversions). Partially offsetting these declines were increases in the value of approvals for New houses (up $60 million or 6.0%) and Non-residential buildings (up $12 million or 2.4%) in the three months to April 2006.
TRADE
The value of Western Australia's trade surplus rose by 9.0% through the year to March quarter 2006, a large deceleration from growth of 34.5% in the previous period. Much of the deceleration was caused by interruptions to mining production and exports during the quarter (particularly nickel ore and petroleum) as a result of Tropical Cyclones Clare and Glenda crossing the Pilbara coast on 9 January and 30 March respectively, as well as a substantial increase in imports. The value of Western Australia's exports grew by 20.6% through the year to March quarter 2006, well below the growth of 39.9% in the value of imports. To put this in perspective, three quarters (72.6%) of the aggregate growth in exports ($1,900 million) was offset by imports growth ($1,379 million) through the year.
VALUE OF WESTERN AUSTRALIA'S TRADE SURPLUS, Change from same quarter previous year
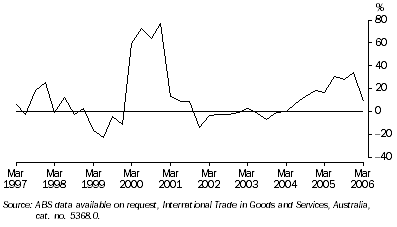
Between the March quarters of 2005 and 2006, the value of Western Australia's trade surplus rose by $521 million to $6,313 million. The main contributors to the rise were increases in the state's trade surplus with the United Kingdom (up $791 million), China (up $568 million), the Republic of Korea (up $384 million) and Japan (up $357 million). Partially offsetting these increases were decreases in Western Australia's trade balance with Thailand (down $488 million to a surplus of $58 million), Singapore (down $377 million to a deficit of $322), the United States of America (down $187 million to a deficit of $354 million) and Indonesia (down $167 million to a deficit of $42 million).
Exports
The value of Western Australia's exports rose by 20.6% ($1,900 million) to $11,145 million through the year to March quarter 2006. The major commodities contributing to the increase were Iron ore and concentrates (up $1,101 million or 64.5%), Non-monetary gold (up $326 million or 24.3%) and Natural gas (up $213 million or 28.1%). Constraining growth through the year were falls in exports of Nickel ores and concentrates (down $90 million or 47.6%), Refined petroleum oils (down $34 million or 20.0%) and Crude petroleum oils (down $28 million or 2.3%), negatively affected by cyclone activity in the state's north-west during the March quarter 2006.
Imports
The value of Western Australia's imports rose by 39.9% ($1,379 million) to $4,832 million through the year to March quarter 2006. The major commodities contributing to the increase were Non-monetary gold (up $856 million or 206.8%), Refined petroleum oils (up $159 million or 86.3%) and Crude petroleum oils (up $92 million or 23.3%).
MINING
Mineral and petroleum exploration expenditure
Mineral exploration has continued to decline in Western Australia over the last three quarters. Mineral exploration expenditure (trend) peaked at $156 million in the June quarter 2005 and has since fallen to $144 million in the March quarter 2006. During the March quarter expenditure on mineral exploration fell by 2.6% or $4 million, mainly due to the impact of Tropical Cyclones Clare and Glenda on exploration activity in the state's north-west and difficulties in accessing land.
MINERAL EXPLORATION EXPENDITURE, Total minerals
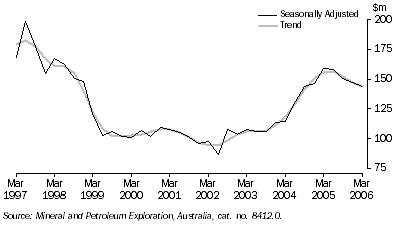
In original terms, mineral exploration expenditure fell by 9.6% ($13 million) in Western Australia through the year to March quarter 2006. The major mineral driving the decline was Nickel, cobalt (down $21 million or 51.8%), while Iron ore (up $4 million or 13.6%) partially offset the fall. The large decrease in nickel exploration coincides with an 18.1% fall in nickel prices over the second half of 2005, from a peak of $22,095 per tonne in May to $18,106 per tonne in December. Petroleum exploration expenditure also declined in Western Australia, falling by 11.2% ($17 million) to $137 million through the year to March quarter 2006, also hampered by the effects of the two cyclones.
Mineral and energy production
The production of minerals and energy in Western Australia were also interrupted by Tropical Cyclones Clare and Glenda. Production fell across most major commodities through the year to March quarter 2006, including Nickel (down 22.4%), Crude oil (down 13.8%), Diamonds (down 12.3%), Gold (down 11.1%), Electricity (down 6.9%), Bauxite (down 2.2%) and Iron ore (down 1.5%). Increases were, however, recorded for the production of Zinc (up 207.7%), Coal (up 10.6%), Ilmenite (up 9.4%) and Natural gas (up 8.5%).
TOURISM
Short-term arrivals on holiday
A total of 62,637 overseas visitors arrived in Western Australia by air on holiday in the three months to March 2006 - 6,462 fewer than in the same period of 2005. The largest declines in visitor arrivals over the period were from Singapore (down 4,313 or 39.7%) and Malaysia (down 2,022 or 34.3%). Despite the overall decline, visitor arrivals increased from several countries, including the United Kingdom and Ireland (up 678 or 3.3%) and Europe (up 353 or 4.0%).
SHORT-TERM VISITOR ARRIVALS AND RESIDENT DEPARTURES OVERSEAS, By air on holiday

Short-term departures on holiday
The number of Western Australian residents departing by air on holiday overseas fell by 3,840 (6.7%) to total 53,076 over the three months to March 2006, compared to the same period of 2005. The largest fall in resident departures over the period was to Indonesia (down 11,798 or 58.8%) following the bombing in Bali on 1 October 2005. Falls were also recorded in resident departures to New Zealand (down 1,177 or 15.6%) and Singapore (down 859 or 12.5%). Large increases in resident departures were recorded to Thailand (up 3,415 or 100.5%) and Malaysia (up 1,280 or 35.2%).
LABOUR MARKET
Job vacancies
The number of job vacancies (original) in Western Australia reached 20,600 in the February quarter 2006, an increase of 5,300 (35.1%) from the February quarter 2005. Nearly all of this rise was attributable to a 37.3% increase in private sector vacancies, while public sector vacancies rose by 10.6%. Given job vacancies are a leading indicator of employment, employment growth can be expected to continue through mid-2006 if suitably qualified workers are able to be found to fill the rising number of vacancies being created by the expanding Western Australian economy.
Employment
The number of employed persons (trend) in Western Australia rose by 4,600 (0.4%) in the three months to May 2006, slightly down on the growth of 5,500 persons (0.5%) in the previous three month period. Almost half (47.8%) of the current increase was driven by full-time employment, up 2,200 or 0.3%, while part-time employment contributed the rest. As at May 2006, there were 1,065,700 persons employed in the state's labour force, with 752,800 (70.6%) employed full-time. Full-time employed males drove most of the increase in state employment, rising by 3,400 persons or 0.7% during the last three months, while part-time employed females also made a significant contribution (up an estimated 3,100 persons or 1.4%).
EMPLOYED PERSONS, Total
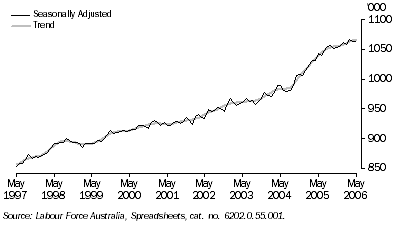
In original terms, the number of employed persons rose by 22,200 or 2.1% in the state through the year to May 2006. The industries driving the increase were Personal and other services (up 7,700 persons or 20.2%), Mining (up 6,000 persons or 12.3%) and Wholesale trade (up 5,900 persons or 14.1%). Partially offsetting these increases were declines in the number of persons employed in Education (down 7,700 or 10.2%) and Agriculture, forestry and fishing (down 5,300 or 9.9%).
Unemployment
The number of unemployed persons (trend) in Western Australia fell by 3,600 or 8.0% in the three months to May 2006, following a decline of 400 persons or 0.9% in the previous three month period. The sharp decline in unemployed persons in the state's labour force has seen the unemployment rate drop from 4.1% in February 2006 to a record low of 3.7% in May 2006 - well below the 5.0% rate of unemployment across the nation.
UNEMPLOYMENT RATE(a)

Participation
The proportion of the Western Australian civilian population participating in the state's labour force declined from 67.8% in February 2006 to 67.6% in May 2006, possibly having some effect on lowering the unemployment rate in the state (i.e. some unemployed persons may have dropped out of the labour force), as well as some influence on lowering female full-time employment (down 1,200 persons or 0.5%) and male part-time employment (down an estimated 700 persons or 0.8%) over the last three months.
 Print Page
 Print All