DECEMBER KEY FIGURES
 |  | Credit market outstandings at end | Demand for credit during | Other changes during | Credit market outstandings at end |
 |  | Sep Qtr 2013 | Dec Qtr 2013 | Dec Qtr 2013 | Dec Qtr 2013 |
| NON-FINANCIAL DOMESTIC SECTORS | $b | $b | $b | $b |
|
| Non-financial corporations |  |  |  |  |
 | Investment funds | 186.1 | 5.0 | -3.4 | 187.8 |
 | Other private | 2 285.4 | 26.3 | 26.5 | 2 338.2 |
 | National public | 1.3 | 1.1 | - | 2.4 |
 | State and local public | 107.3 | 1.3 | - | 108.7 |
| General government |  |  |  |  |
 | National | 311.7 | 19.1 | -5.2 | 325.5 |
 | State and local | 142.4 | 2.6 | - | 145.0 |
| Households | 1 737.1 | 26.8 | 2.7 | 1 766.6 |
| Total | 4 771.4 | 82.3 | 20.4 | 4 874.1 |
|
| - nil or rounded to zero (including null cells) |
Total demand for credit

| Credit market outstandings

|
DECEMBER KEY POINTS
SUMMARY
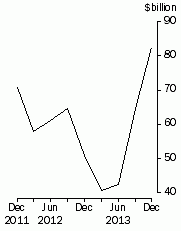
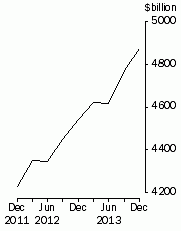
- Total credit market outstanding of the domestic non-financial sectors at 31 December 2013 was $4,874.1b, an increase of $102.7b from the previous quarter. Demand for credit during the quarter was $82.3b and valuation increases were $20.4b.
- Demand for credit increased by $17.8b from the previous quarters level, driven by households (up $12.1b), private non-financial investment funds (up $5.4b), and other private non-financial corporations (up $3.3b). This was offset by a decreased demand for credit by state and local general government (down $3.3b).
NON-FINANCIAL CORPORATIONS
- Other private non-financial corporations raised a net $26.3b; through net transactions and equity issuance of $17.3b, loan borrowings of $13.0b, and bond issuance of $3.7b.
GENERAL GOVERNMENT
- National general government raised a net $19.1b during the quarter driven by issuances of bonds of $16.5b. State and local general government raised $2.6b during the quarter through loan borrowings of $2.6b.
HOUSEHOLDS
- Households raised a net $26.8b primarily through loans of $27.4b during the December quarter 2013, up $12.2b from the September quarter 2013 estimate of $15.2b.
NOTES
FORTHCOMING ISSUES
| ISSUE (QUARTER) | Release Date |
| March 2014 | 26 June 2014 |
| June 2014 | 25 September 2014 |
| September 2014 | 18 December 2014 |
| December 2014 | 26 March 2015 |
CHANGES TO THIS ISSUE
- This issue includes a feature article Gross Public Sector Debt: Concepts and Measurement. This article explores the concept of debt, examines the IMF approach of presenting public sector debt data and looks at the way Australia currently measures public sector debt.
SIGNIFICANT EVENTS
- The previously announced revisions to the published aggregates back to June quarter 1988 as part of the quality assurance work undertaken through reviews of compilation methods and through data providers to the ABS is still scheduled to be released in the March quarter 2014 issue of this publication.
- During the December quarter 2013, the deposit activity of a unit has been confidentialised to maintain the anonymity of the unit. As a consequence of suppressing estimates directly impacted, other series have been consequentially suppressed in affected tables to preserve confidentiality.
REVISIONS IN THIS ISSUE
There have been revisions to previously published aggregates:
- from March 2012 onwards, revisions are due to quality assurance reviews of the compilation of published estimates and through data providers to the ABS Survey of Financial Information, ABS Survey of International Investment and APRA administrative data sets.
- from June 1988 onwards, there are small revisions to the sectorial capital accounts due to updated sources and methodology.
INQUIRIES
- For further information about these and related statistics, contact the National Information and Referral Service on 1300 135 070 or John Mitchell on Canberra (02) 6252 7910, email <national.accounts@abs.gov.au>. The ABS Privacy Policy outlines how the ABS will handle any personal information that you provide to us.
 Quality Declaration
  Print Page
 Print All