|
|
Summary of Findings
Introduction
In April 2003, there were approximately 2,647,500 children aged 5-14 years. Outside of school hours, in the 12 months prior to the survey, it is estimated that:
- 2,641,500 (99.8%) participated in selected leisure activities, the most frequent activities being watching television or videos, reading for pleasure and playing electronic or computer games
- 1,630,400 (62%) participated in organised sport
- 780,400 (29%) were involved in selected organised cultural activities
- 755,400 (29%) did not participate in organised sport or selected organised cultural activities.
During or outside of school hours, in the 12 months prior to the survey, it is estimated that 95% of all children used a computer (2,517,500) and 64% accessed the Internet (1,693,300).
Changes in participation since 2000
Changes, from 2000, in children's participation outside of school hours, include:
- an 8 percentage point decrease in the proportion of children who skateboarded or rollerbladed
- a 5 percentage point increase in the proportion of children who did art and craft activities.
Internet usage increased for both boys (48% in 2000 to 62% in 2003) and girls (46% in 2000 to 66% in 2003). Overall, there was an increase of 17 percentage points in the proportion of children accessing the Internet.
There was an overall increase in the participation rate for girls in organised cultural activities from 40% in 2000 to 43% in 2003. The increase was largely attributable to an increase for dancing. Similarly, participation in art and craft activities increased for girls from 55% in 2000 to 61% in 2003. By contrast, for boys there was an overall decrease in the participation rate in organised cultural activities from 20% in 2000 to 17% in 2003, but an increase in art and craft activities from 34% in 2000 to 39% in 2003.
Overall, there was an increase of 2 percentage points in the rate of participation in organised sport. While participation in organised sports increased for boys (66% in 2000 to 69% in 2003), there was no statistically significant change for girls.
SELECTED ORGANISED CULTURAL ACTIVITIES
Participation
There were 780,400 (29%) children involved in selected organised cultural activities, outside of school hours. It is estimated that of children aged 5-14 years (2,647,500):
- 445,500 (17%) played a musical instrument
- 329,300(12%) participated in dancing
- 122,500 (5%) were involved in singing
- 112,600 (4%) were involved in drama.
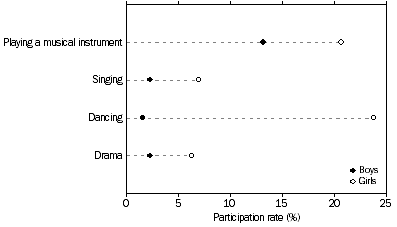
These activities were more popular with girls than boys. Over four in ten girls (43%) were involved in at least one of the selected cultural activities (552,000), compared with 17% of boys (228,500). Dancing was the most popular of these activities for girls (24% or 307,100), but the least popular for boys (2% or 22,200). For boys, the most popular activity was playing a musical instrument (13% or 179,000).
Some 7% of children (2% of boys and 12% of girls) participated in more than one organised cultural activity (182,900).
PARTICIPATION IN ORGANISED CULTURAL ACTIVITIES, By sex

Comparing states and territories, children in Western Australia had the highest participation rate (33%) in selected organised cultural activities, while children in the Northern Territory had the lowest (25%). Across all the states and territories, playing a musical instrument was the most common selected organised cultural activity. This was followed by dancing. For singing, the Northern Territory had the highest participation rate (7%), while Victoria had the lowest participation rate (4%). For dancing, New South Wales had the highest participation rate (14%), while the Australian Capital Territory had the lowest (8%).
Comparing age groups, children aged 9-11 years had the highest participation rate (36%) in selected cultural activities. This was followed by children aged 12-14 years (30%) and children aged 5-8 years (24%).
Organised lessons
During the 12 month period, 94% of children involved in dancing had dancing lessons (311,000). This compares with 80% of children involved in drama receiving drama lessons (90,200), 78% of children playing a musical instrument receiving music lessons (349,300) and 70% of children involved in singing receiving singing lessons (85,600).
Frequency and duration
Of those children who played a musical instrument, 45% did so (practised at home or elsewhere, had lessons or performed with their musical instrument) more than once a week (200,600). Of those who did dancing, 22% (71,700) did so (practiced at home or elsewhere, had lessons or performed with dancing) more than once a week. This compares with 14% of children involved in singing (17,400) and 3% of children involved in drama (3,400).
Children who played a musical instrument spent on average 4 hours, over two school weeks, on this activity (practised at home or elsewhere, had lessons or performed with their musical instrument). Children who did dancing spent on average 4 hours, over two school weeks, on their activity (practiced at home or elsewhere, had lessons or performed with singing) also. For those who did singing, the average time spent singing was 3 hours and for those involved in drama, 2 hours.
ORGANISED SPORT
Participation
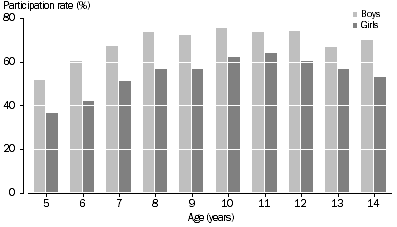
In the 12 months to April 2003, an estimated 1.6 million (62%) children participated in sport, outside of school hours, which had been organised by a school, club or association. Participation in organised sport ranged from 44% of children aged 5 years (112,500) to 69% of 10 year olds (185,800). Across all of the age groups, boys had a higher participation rate (69%) in organised sport than girls (54%). Nearly one-third (29%) of children (774,000) participated in two or more organised sports - 35% for boys (478,700) and 23% for girls (295,300).
PARTICIPATION IN ORGANISED SPORT, By age

Comparing states and territories, children in Western Australia had the highest participation rate (66%) in organised sport, followed by Victoria (65%), while children in Queensland had the lowest (54%).
Sports with most participants
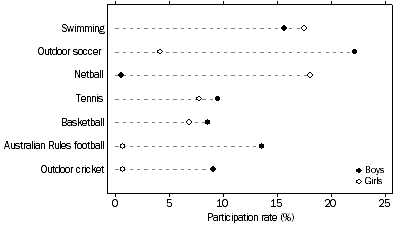
The most popular sport for children was swimming with a participation rate of 17% (439,100) followed by outdoor soccer (13% or 355,900). For boys, the most popular sports were outdoor soccer (22% or 301,100), swimming (16% or 213,600), Australian Rules football (14% or 184,200), tennis (9% or 128,300), outdoor cricket (9% or 124,200) and basketball (9% or 116,100). For girls, the most popular sports were netball (18% or 233,000), swimming (17% or 225,500), tennis (8% or 100,100) and basketball (7% or 88,900).
Participation in most popular sports

Frequency and duration
For those children involved in organised sport outside of school hours (1,630,400), it is estimated that:
- nearly half (49%) trained or played more than once a week, outside of school hours
- an average of 5 hours per school fortnight were spent participating in organised sport outside of school hours
- those aged 5-8 years spent on average 4 hours per school fortnight participating in organised sport outside of school hours, and those aged 12-14 years, 6 hours.
NON-PARTICIPANTS
In the 12 months prior to April 2003, 71% of children did not participate in any of the selected organised cultural activities (1,867,100). This compares with 38% of children who did not participate in any organised sport outside of school hours (1,017,100). Some 83% of boys did not participate in any of the selected cultural activities (1,129,200) compared with 31% who did not participate in organised sport (425,800). For girls, 57% did not participate in any of the selected cultural activities (737,900) compared with 46% who did not participate in organised sport (591,300).
During the year, 755,400 children (29%) did not participate in any of the selected organised cultural activities or organised sport outside of school hours. Of these children, it is estimated that:
- 29% of girls (376,200) did not participate compared with 28% of boys (379,200)
- 35% of children aged 5-8 years (366,400) did not participate compared with 22% of children aged 9-11 years (178,400)
- 43% of children born overseas in non-English speaking countries (39,900) did not participate compared with 28% of children born in Australia (696,100) and 27% born overseas in English speaking countries (19,400)
- 40% of children in single-parent families (225,300) did not participate compared with 26% of children in couple families (530,100).
SELECTED LEISURE ACTIVITIES
Participation
Almost all children (99.8%) participated in at least one of the selected leisure activities outside of school (2,641,500). It is estimated that, within the total population of children aged 5-14 years (2,647,500):
- 2,601,000 (98%) watched television or videos
- 1,981,000 (75%) spent time reading for pleasure
- 1,870,500 (71%) played electronic or computer games
- 1,644,800 (62%) rode their bike
- 1,311,200 (50%) participated in art and craft activities
- 604,500 (23%) skateboarded or rollerbladed.
For boys, the most popular leisure activities were watching television or videos (99% or 1,338,600), playing electronic or computer games (82% or 1,110,800), bike riding (70% or 957,400), reading for pleasure (68% or 919,200), art and craft (39% or 529,800), and skateboarding or rollerblading (28% or 386,400). For girls, the most popular leisure activity was watching television or videos (98% or 1,262,400), followed by reading for pleasure (82% or 1,061,800), art and craft (61% or 781,500), playing electronic or computer games (59% or 759,700), bike riding (53% or 687,400), and skateboarding or rollerblading (17% or 218,200).
Time spent
Watching television or videos was the most popular of all the selected activities (including cultural and sports activities) (2,601,000 or 98% of all children). Most children spent more time watching television or videos than they did on any of the other selected activities. Children spent an average 22 hours over a school fortnight watching television or videos.
Reading for pleasure (1,981,000 or 75%), and playing electronic or computer games (1,870,500 or 71%) were also popular leisure activities for children. Participants in these activities spent an average of 8 hours over a school fortnight involved in each of these activities.
For those children who participated in bike riding (1,644,800 or 62%), and art and craft activities (1,311,200 or 50%), the average time spent on each of these activities was 6 hours over a school fortnight.
Skateboarding or rollerblading (604,500 or 23%) was the least popular of the selected leisure activities and had the lowest average duration of participation at 5 hours over a school fortnight.
COMPUTER ACTIVITIES
Participation
In the 12 months to April 2003 most (95%) children aged 5-14 years used a computer during or outside of school hours. For these children (2,517,500), it is estimated that:
- 2,369,200 (94%) used a computer at school
- 2,165,300 (86%) used a computer at home
- 1,050,800 (42%) used a computer at someone else's home
- 303,300 (12%) used a computer at a public library.
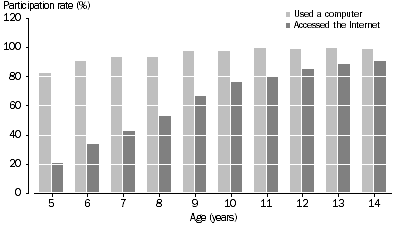
Participation in computer activities was comparable for boys and girls. Computer usage increased with age from 82% for 5 year olds to 99% for children aged 11 years and older.
During the year, most of the children who used a computer at home did so more than once a week (74% or 1,603,400). Some 19% of children did so every day (416,500). The activities for which these children used the home computer varied with their age. For the 5-8 year olds, 91% used the computer to play games (685,300), 70% used it for educational purposes (525,000) and 25% used it to email or do other Internet based activities (187,400). For 12-14 year olds, 94% used the computer for educational purposes (680,000), 76% used it for playing games (546,600) and 69% for emailing and other Internet based activities (499,000).
Internet usage
In the 12 months to April 2003, the Internet was accessed by 1,693,300 children during or outside of school hours. This was 64% of all children, aged 5-14 years, and 67% of children who used computers. The proportion of females who accessed the Internet was slightly higher (66%) than the proportion of males who accessed the Internet (62%). Across the age groups, 21% of children aged 5 years used the Internet, compared with 90% of 14 year olds.
Computer and internet usage, By age

For those children who accessed the Internet, it is estimated that:
- 1,341,600 (79%) accessed the Internet at home
- 1,181,900 (70%) accessed the Internet at school
- 412,400 (24%) accessed the Internet at someone else's home
- 117,000 (7%) accessed the Internet at a public library
- 57,200 (3%) accessed the Internet at other places (e.g. Internet cafes).
Use of the Internet varied across the age groups:
- For 5-8 year olds, popular uses of the Internet at home were to play games (68% or 204,200), school or educational tasks (65% or 194,600), browsing for leisure (24% or 71,200), and using email or chat rooms (23% or 68,500)
- For 9-11 year olds, the Internet was used at home for school or educational tasks (89% or 409,000), playing games (60% or 275,300), using email or chat rooms (40% or 184,100), and browsing for leisure (39% or 181,100)
- For 12-14 year olds, popular uses of the Internet at home were for school or educational tasks (94% or 545,700), using email or chat rooms (67% or 390,700), playing games (52% or 300,200) and browsing for leisure (50% or 291,000)
- Over half (61%) of the children who accessed the Internet at home, did so more than once a week (824,800) and some (14% or 193,400) did so every day. The majority (70%) of children who accessed the Internet at home everyday were 12-14 year olds, followed by 9-11 year olds (23%), and 5-8 year olds (7%).
|
 Print Page
 Print All