NOTES
ABOUT THIS PUBLICATION
This publication presents summary statistics on deaths registered in Australia where the underlying cause of death was determined to be suicide. These statistics were compiled from data made available to the Australian Bureau of Statistics (ABS) by the Registrar of Births, Deaths and Marriages and coroners in each State or Territory. Data are presented for suicide deaths registered in the years 1995 to 2005, by sex and age group, and method of suicide. State and territory death rates from suicide are also presented.
Caution
The quality of cause of death coding is affected by a range of factors including delays in finalising coronial processes. See paragraphs 6 to 10 of the Explanatory Notes. The level of recorded deaths attributed to suicide, and observed changes over time are likely to have been affected by delays in finalising a cause. More information about these issues will be provided in Information Paper: External Causes of Death, Data Quality 2005 (cat.no. 3317.0.55.001) to be released in April 2007.
INQUIRIES
For further information about these and related statistics, contact the National Information and Referral Service on 1300 135 070.
SUMMARY COMMENTARY
INTRODUCTION
Suicide continues to be a major public health issue. Although death by suicide is a relatively uncommon event (occurring at a rate of about 1 per 10,000 population per year), the human and economic costs are substantial.
Suicide can be defined as the deliberate taking of one's life (footnote 1) . To be classified as a suicide, a death must be recognised as being due to other than natural causes. It must also be established by coronial enquiry that the death resulted from a deliberate act of the deceased with the intention of ending his or her own life.
This publication contains summary statistics on deaths registered in Australia between 1995 and 2005 (the most recent year for which data are available), where the underlying cause of death was determined as suicide. Data on deaths from suicide are presented disaggregated by sex, age, method of suicide and state or territory of usual residence.
All data are presented by year of registration, rather than the year in which the death occurred. Over the last decade, around 93% of suicide deaths were registered in the same year in which the death occurred, and 7% in the year immediately following.
OVERALL TRENDS
Total number of suicide deaths
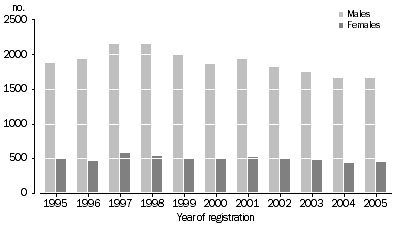
There were 2,101 deaths from suicide registered in 2005, similar to the number registered in the previous year (2,098). Nearly 80% of these were deaths of males.
SUICIDE, TOTAL NUMBER OF DEATHS
Suicide as proportion of total deaths
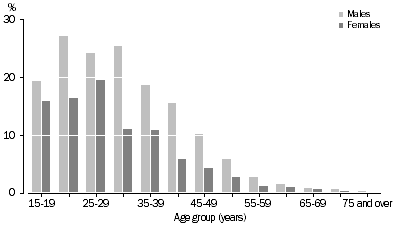
While suicide accounts for only a small proportion (1.6%) of deaths of persons of all ages, it accounts for a greater proportion of deaths from all causes in specific age groups (see graph below). For example, suicide deaths make up more than 20% of deaths from all causes, in each five year age group for males between 20 to 34 years. Similarly for females, suicide deaths comprise a much higher proportion of total deaths in younger age groups compared with older age groups (see Table 7).
SUICIDE AS PROPORTION OF TOTAL DEATHS 2005
Age-standardised rates
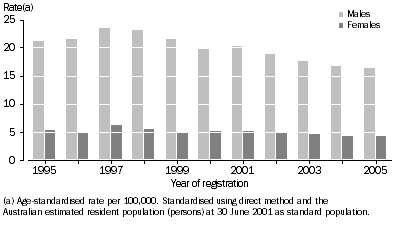
The age-structure of the Australian population has changed over time. Age standardisation allows comparison of rates between populations with different age structures. The age-standardised suicide rate (for persons) in 2005 was 1% lower than the corresponding rate for the previous year and 30% lower than in 1997.
The age-standardised suicide rate in 2005 for males was 16.4 per 100,000 while the corresponding rate for females was 4.3 per 100,000 (see Table 1).
Throughout the period 1995 to 2005 the male age-standardised suicide death rate was approximately four times higher than the corresponding female rate, as can be seen in the following graph.
AGE-STANDARDISED DEATH RATES FOR SUICIDE
AGE
Median age
The median age at death for suicide in 2005 was 41.4 years for males and 44.1 years for females (see Table 1). In comparison, the median age for deaths from all causes in 2005 was 76.8 for males and 82.9 years for females.
Age-specific rates
The pattern of age-specific rates in 2005 for suicide in males and females is shown in the graph below.
AGE-SPECIFIC SUICIDE RATES 2005
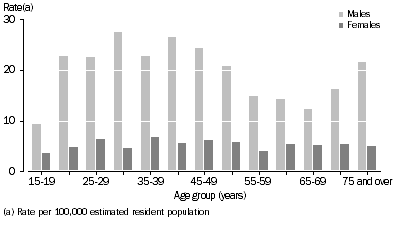
The highest age-specific suicide death rate for males in 2005 was observed in the 30-34 years age group (27.5 per 100,000 ) and the lowest was in the 15-19 years age group (9.5 per 100,000). For females the highest age-specific suicide death rate in 2005 was observed in the 35-39 years age group (6.9 per 100,000) and the lowest in the 15-19 years age group (3.6 per 100,000)(see Table 3).
METHOD OF SUICIDE
In 2005 the most frequent method of suicide was hanging (including strangulation and suffocation) which was used in half (51%) of all suicide deaths. Poisoning by drugs was used in 12% and poisoning by other methods (including by motor vehicle exhaust) was used in 16% of suicide deaths. Methods using firearms accounted for 7% of suicide deaths. The remaining group (Other) comprised 14% of suicide deaths and included deaths from drowning, jumping from a high place, and other methods. Suicide deaths using firearms have more than halved over the last ten years, from 389 deaths in 1995, to 147 deaths in 2005. See Table 5 for data on broad groupings of method of suicide.
STATE AND TERRITORY
Suicide rates in states and territories may fluctuate over time particularly in the smaller jurisdictions, because of the small number of suicides that may be registered annually. In addition, quality issues relating to delays in finalising coronial processes may also vary across the jurisdictions. Therefore caution should be exercised when comparing annual state and territory suicide data (see Table 5).
Other factors such as the higher rate of suicide in rural areas may contribute to differences across states and territories. In the Northern Territory, the high rate of suicide in the Indigenous population contributes to the high rate of suicide in that jurisdiction. See The Health and Welfare of Australia's Aboriginal and Torres Strait Islander Peoples, 2005 (cat. no. 4704.0, page 159) for more information on suicide deaths in the Indigenous population.
Combining data for five years allows more reliable comparison of suicide rates across the states and territories. The graph below shows age-standardised suicide rates for the states and territories using the most recent five years of data (registration years 2001-2005) combined (Table 6).
SUICIDE BY STATE AND TERRITORY 2001-2005, age-standardised rates
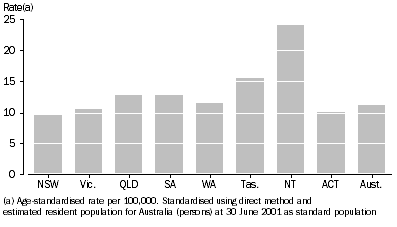
For this period, high rates were evident in the Northern Territory (more than double the national rate), followed by Tasmania (39% above the national rate) and Queensland and South Australia (14% above the national rate). New South Wales, Victoria and the ACT all had rates lower than the national rate.
Butterworths Concise Australian Legal Dictionary, 1997, Butterworths Sydney. (back)
 Print Page
 Print All