SEPTEMBER KEY FIGURES
 | | Jun Qtr 2018 | Sep Qtr 2018 |
| | $m | $m |
|
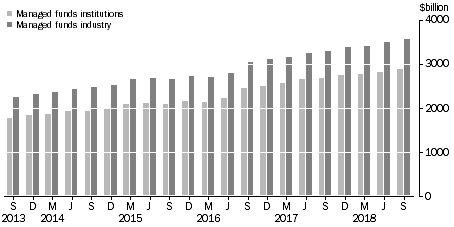
| Total managed funds industry | 3 478 948 | 3 549 461 |
| Consolidated assets total managed funds institutions | 2 824 559 | 2 883 459 |
| Cross invested assets between managed funds institutions | 572 850 | 577 657 |
| Unconsolidated assets total managed funds institutions | 3 397 409 | 3 461 116 |
| | |
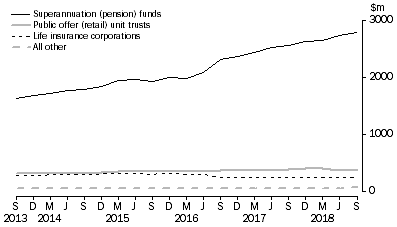
| Life insurance corporations | 240 764 | 239 936 |
| Superannuation (pension) funds | 2 727 791 | 2 781 369 |
| Public offer (retail) unit trusts | 374 723 | 381 916 |
| All other managed funds institutions | 54 131 | 57 895 |
|
Managed Funds
| Unconsolidated Assets, by type of institution
|
SEPTEMBER KEY POINTS
TOTAL MANAGED FUNDS INDUSTRY
- At 30 September 2018, the managed funds industry had $3,549.5b funds under management, an increase of $70.5b (2.0%) on the June quarter 2018 figure of $3,478.9b.
- The main valuation effects that occurred during the September quarter 2018 were as follows: the S&P/ASX 200 increased 0.2%; the price of foreign shares, as represented by the MSCI World Index excluding Australia, increased 4.7%; and the A$ depreciated 2.3% against the US$.
CONSOLIDATED ASSETS OF MANAGED FUNDS INSTITUTIONS
- At 30 September 2018, the consolidated assets of managed funds institutions were $2,883.5b, an increase of $58.9b (2.1%) on the June quarter 2018 figure of $2,824.6b.
- The asset types that increased were units in trusts, $21.8b (2.9%); overseas assets, $16.2b (3.3%); derivatives, $5.2b (16.1%); bonds, etc., $3.7b (4.1%); shares, $3.4b (0.7%); other financial assets, $3.0b (1.3%); land, buildings and equipment, $3.0b (1.0%); deposits, $1.8b (0.7%); loans and placements, $1.0b (2.5%) and other non-financial assets, $0.1b (1.3%). These were partially offset by a decrease in short term securities, $0.3b (0.3%).
CROSS INVESTED ASSETS
- At 30 September 2018, there were $577.7b of assets cross invested between managed funds institutions.
UNCONSOLIDATED ASSETS
- At 30 September 2018, the unconsolidated assets of superannuation (pension) funds increased $53.6b (2.0%), public offer (retail) unit trusts increased $7.2b (1.9%), cash management trusts increased $3.4b (9.6%), common funds increased $0.2b (2.3%) and friendly societies increased $0.1b (1.1%). Life insurance corporations decreased $0.8b (0.3%).
NOTES
FORTHCOMING ISSUES
| ISSUE (QUARTER) | Release Date |
| December 2018 | 7 March 2019 |
| March 2019 | 6 June 2019 |
| June 2019 | 5 September 2019 |
| September 2019 | 12 December 2019 |
REVISIONS
- Table 3 Life insurance corporations - revised back to June quarter 2018.
- Table 4 Superannuation (pension) funds - revised back to September quarter 2016.
- Table 5 Public offer (retail) unit trusts - revised back to September quarter 2011.
- Table 6 Friendly Societies - no revisions.
- Table 7 Common funds - no revisions.
- Table 8 Cash management trusts - no revisions.
- Table 9 Resident Investment Managers - revised back to December quarter 2011.
PRIVACY
The
ABS Privacy Policy outlines how the ABS will handle any personal information that you provide to the ABS.
INQUIRIES
For further information about these and related statistics, contact the National Information and Referral Service on 1300 135 070.
 Print Page
 Print All