OCTOBER KEY FIGURES
 | Trend estimates | Seasonally adjusted estimates |
 | Oct 2017 | Sep 2017 to Oct 2017 | Oct 2017 | Sep 2017 to Oct 2017 |
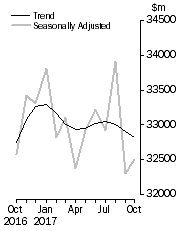
Value of dwelling commitments(a)(b) |
|
 | $m | % change | $m | % change |
| Total dwellings | 32 821 | -0.3 | 32 503 | 0.6 |
| Owner occupied housing | 20 811 | -0.1 | 20 545 | 0.0 |
| Investment housing - fixed loans(c) | 12 009 | -0.5 | 11 958 | 1.6 |
Number of dwelling commitments(a)(b) |
|
 | no. | % change | no. | % change |
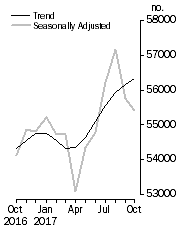
| Owner occupied housing | 56 316 | 0.3 | 55 406 | -0.6 |
| Construction of dwellings | 6 229 | -0.5 | 6 075 | -1.4 |
| Purchase of new dwellings | 3 190 | 1.0 | 3 132 | -1.6 |
| Purchase of established dwellings | 46 897 | 0.3 | 46 199 | -0.4 |
|
| (a) Includes refinancing (see Glossary). |
| (b) Excludes alterations and additions. |
| (c) Excludes revolving credit. |
Value of dwelling commitments, Total dwellings

| No. of dwelling commitments, Owner occupied housing

|
OCTOBER KEY POINTS
VALUE OF DWELLING COMMITMENTS
October 2017 compared with September 2017:
- The trend estimate for the total value of dwelling finance commitments excluding alterations and additions fell 0.3%. Owner occupied housing commitments fell 0.1% and investment housing commitments fell 0.5%.
- In seasonally adjusted terms, the total value of dwelling finance commitments excluding alterations and additions rose 0.6%.
NUMBER OF DWELLING COMMITMENTS
October 2017 compared with September 2017:
- In trend terms, the number of commitments for owner occupied housing finance rose 0.3% in October 2017.
- In trend terms, the number of commitments for the purchase of new dwellings rose 1.0% and the number of commitments for the purchase of established dwellings rose 0.3% while the number of commitments for the construction of dwellings fell 0.5%.
- In original terms, the number of first home buyer commitments as a percentage of total owner occupied housing finance commitments rose to 17.6% in October 2017 from 17.4% in September 2017.
NOTES
FORTHCOMING ISSUES
| ISSUE | Release Date |
| November 2017 | 17 January 2018 |
| December 2017 | 9 February 2018 |
| January 2018 | 13 March 2018 |
| February 2018 | 12 April 2018 |
| March 2018 | 11 May 2018 |
| April 2018 | 12 June 2018 |
IMPORTANT QUALITY NOTICE: FIRST HOME BUYERS NUMBERS
The number of loans to first home buyers has recorded strong growth in recent months. The increase has been driven mainly by changes to first home buyer incentives made in July by the New South Wales and Victorian governments. The ABS is working with APRA and the financial institutions to establish the size of the increase in first home buyer lending in recent months and improve the quality of first home buyer statistics more broadly. These numbers may be revised and users should take care when interpreting recent ABS first home buyer statistics.
REVISIONS
In this issue, revisions have been made to the original series as a result of improved reporting of survey and administrative data. These revisions have affected the following series:
- Owner occupied housing for the periods August 2017 and September 2017.
- Housing loan outstandings for the periods October 2016 to September 2017.
- Investment housing for the periods August 2017 and September 2017.
PRIVACY
The
ABS Privacy Policy outlines how the ABS will handle any personal information that you provide to the ABS.
INQUIRIES
For further information about these and related statistics, contact the National Information and Referral Service on 1300 135 070.
 Quality Declaration
  Print Page
 Print All