11/07/2008 Note: Time Series Spreadsheets containing population by single year of age and sex for each state and territory from June 1971 to June 2007 released.
NOTES
ABOUT THIS PUBLICATION
This issue contains estimates of the resident population of Australian states and territories as at 30 June of each reference year. Estimates up to 2006 are final, based on the results of the 2006 Census of Population and Housing, and 2007 estimates are preliminary. For more information on rebasing population estimates over the 2001-2006 intercensal period, see Final Rebasing and Revision of Australia's Population Estimates, September Quarter 2001 - June Quarter 2006 in Australian Demographic Statistics, December Quarter 2007 (cat.no.3101.0).
In recognition of the inherent inaccuracy involved in population estimation, population figures over 1,000 in the text are rounded to the nearest hundred, and figures less than 1,000 are rounded to the nearest ten. While unrounded figures are provided in tables, accuracy to the last digit is not claimed and should not be assumed.
It is recommended that the relevant statistics be rounded by users for commentary based on the statistics in this publication. All data are affected by errors in reporting and processing. No reliance should be placed on statistics with small values.
INQUIRIES
For further information about these and related statistics, contact the National Information and Referral Service on 1300 135 070 or Diala Raad on Canberra (02) 6252 5640.
SUMMARY COMMENTARY
INTRODUCTION
In the 12 months to 30 June 2007, the Australian population increased by 317,162 people, reaching 21,015,042. The annual growth rate for the year ended 30 June 2007 (1.53%) was higher than that recorded for the year ended 30 June 2006 (1.49%).
MEDIAN AGE
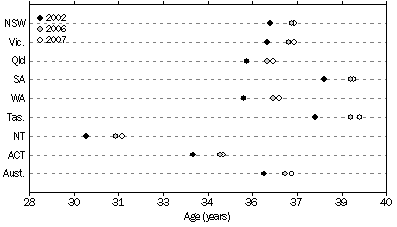
At 30 June 2007, Tasmania had the oldest population of all the states and territories with a median age of 39.1 years. The second oldest was South Australia with a median age of 38.9 years, followed by New South Wales and Victoria (36.9), Western Australia (36.4), Queensland (36.2), the Australian Capital Territory (34.5) and the Northern Territory (31.1). The Northern Territory consistently had the lowest median age of the states and territories over the five years ended 30 June 2007.
MEDIAN AGE(a), By sex - at 30 June |
|  |
 | New South Wales | Victoria | Queensland | South Australia | Western Australia | Tasmania | Northern Territory | Australian Capital Territory | Australia(b) |  |
Males |  |
|  |
| 2002(c) | 35.4 | 35.2 | 34.7 | 36.8 | 34.6 | 36.8 | 30.2 | 32.7 | 35.2 |  |
| 2006(c) | 36.0 | 35.9 | 35.4 | 37.6 | 35.6 | 37.9 | 31.3 | 33.6 | 35.9 |  |
| 2007(d) | 36.2 | 36.1 | 35.6 | 37.8 | 35.8 | 38.3 | 31.3 | 33.7 | 36.1 |  |
Females |  |
|  |
| 2002(c) | 36.9 | 36.8 | 35.9 | 38.9 | 35.9 | 38.4 | 29.7 | 34.2 | 36.6 |  |
| 2006(c) | 37.5 | 37.6 | 36.6 | 39.9 | 36.9 | 39.7 | 30.6 | 35.1 | 37.4 |  |
| 2007(d) | 37.7 | 37.7 | 36.8 | 40.0 | 37.0 | 40.0 | 30.8 | 35.3 | 37.6 |  |
Persons |  |
|  |
| 2002(c) | 36.1 | 36.0 | 35.3 | 37.9 | 35.2 | 37.6 | 29.9 | 33.5 | 35.9 |  |
| 2006(c) | 36.8 | 36.7 | 36.0 | 38.8 | 36.2 | 38.8 | 30.9 | 34.4 | 36.6 |  |
| 2007(d) | 36.9 | 36.9 | 36.2 | 38.9 | 36.4 | 39.1 | 31.1 | 34.5 | 36.8 |  |
|  |
| (a) The median age indicates the age at which half the population is older and half the population is younger. |
| (b) Includes Other Territories - see paragraph 2 of the Explanatory Notes. |
| (c) Figures revised since previous issue. |
| (d) Preliminary figures-subject to further revision. |
Tasmania experienced the largest increase in median age over the five years ending 30 June 2007 at 1.5 years, whilst New South Wales had the smallest increase at 0.8 of a year. Overall for Australia the median age for males has increased by 0.9 of a year, females by 1.0 year and the total population by 0.9 of a year. All states and territories experienced an increase in median age since 30 June 2002, which indicates that Australia has an aging population.
MEDIAN AGE OF POPULATION - at 30 June

SEX RATIOS
The sex ratio relates to the number of males per 100 females in a population or subpopulation. The sex ratio at birth is approximately 105 males per 100 females. Higher male mortality rates at younger ages results in the ratio approaching 100 for the 30-64 years age group. Net Overseas Migration can also influence the sex ratio, especially in the younger working ages where there is often a greater proportion of male migrants. Above age 65, the sex ratio reduces markedly due to the impact of higher male mortality on this population group.
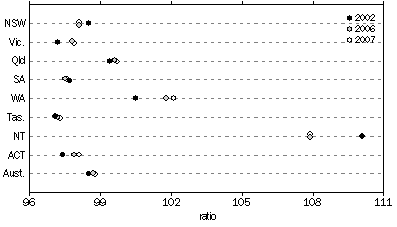
At 30 June 2007, the sex ratio for the total population of Australia was 98.8 males per 100 females. Over the five years ended 30 June 2007, Tasmania, New South Wales, Victoria, Queensland, South Australia and the Australian Capital Territory all had fewer males than females. Tasmania consistently had the lowest sex ratio over the five years 30 June 2002 (97.1) to 30 June 2007 (97.3). Western Australia and the Northern Territory consistently had an excess of males over females for the same period.
SEX RATIO(a), at 30 June |
|  |
 | New South Wales | Victoria | Queensland | South Australia | Western Australia | Tasmania | Northern Territory | Australian Capital Territory | Australia(b) |  |
|  |
| 2002 | 98.5 | 97.2 | 99.4 | 97.7 | 100.5 | 97.1 | 110.1 | 97.4 | 98.5 |  |
| 2003 | 98.4 | 97.3 | 99.3 | 97.7 | 100.7 | 97.3 | 109.3 | 97.5 | 98.5 |  |
| 2004 | 98.3 | 97.5 | 99.4 | 97.6 | 101.1 | 97.2 | 108.6 | 97.6 | 98.6 |  |
| 2005 | 98.2 | 97.6 | 99.5 | 97.6 | 101.4 | 97.2 | 108.0 | 97.8 | 98.6 |  |
| 2006 | 98.1 | 97.8 | 99.6 | 97.5 | 101.8 | 97.2 | 107.9 | 97.9 | 98.7 |  |
| 2007 | 98.1 | 97.9 | 99.7 | 97.6 | 102.1 | 97.3 | 107.9 | 98.1 | 98.8 |  |
|  |
| (a) Males per 100 females. |
| (b) Includes Other Territories - see paragraph 2 of the Explanatory Notes. |
The Northern Territory experienced the largest sex ratio decrease over the five years ending 30 June 2007 falling from 110.1 to 107.9 males per females. Western Australia experienced the largest sex ratio increase over the same period increasing from 100.5 to 102.1 males per 100 females.
SEX RATIO, States and territories
- at 30 June

GROWTH BY AGE GROUP, 2002-2007
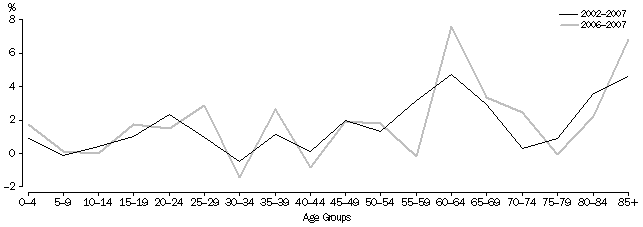
For the 5 years ending June 2007, the population aged 60-64 years recorded the largest growth in Australia, growing 4.7%. The population aged 85 and over also recorded large growth over this period, up 4.6%. These two age groups also recorded the largest growth for the year ending 30 June 2007 growing 7.6% and 6.8 % respectively. This trends reflects the ageing nature of Australia's population.
POPULATION GROWTH BY AGE, 2002-2007

GROWTH BY AGE GROUP, 1987-2007
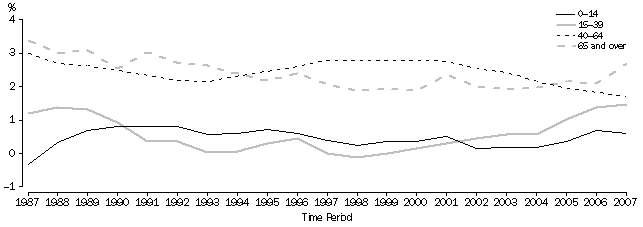
Over the 20 years ended 30 June 2007 Australia’s population aged 0-39 years, experienced slow growth in comparison with the population 40 year and over.
POPULATION GROWTH RATES, Age groups - Australia(a) - at 30 June |
|  |
 | Age groups (years) |  |
 | 0-14 | 15-39 | 40-64 | 65+ |  |
| Period | % | % | % | % |  |
Total population growth rate |  |
|  |
| 1987 | -0.33 | 1.19 | 3.00 | 3.40 |  |
| 1988 | 0.32 | 1.38 | 2.70 | 3.00 |  |
| 1989 | 0.70 | 1.31 | 2.62 | 3.08 |  |
| 1990 | 0.81 | 0.93 | 2.50 | 2.54 |  |
| 1991 | 0.81 | 0.36 | 2.34 | 3.03 |  |
| 1992 | 0.81 | 0.37 | 2.19 | 2.71 |  |
| 1993 | 0.56 | -0.04 | 2.14 | 2.63 |  |
| 1994 | 0.59 | 0.05 | 2.32 | 2.39 |  |
| 1995 | 0.73 | 0.31 | 2.46 | 2.18 |  |
| 1996 | 0.60 | 0.46 | 2.60 | 2.40 |  |
| 1997 | 0.39 | 0.01 | 2.80 | 2.07 |  |
| 1998 | 0.24 | -0.12 | 2.80 | 1.89 |  |
| 1999 | 0.38 | 0.02 | 2.80 | 1.93 |  |
| 2000 | 0.38 | 0.15 | 2.80 | 1.88 |  |
| 2001 | 0.53 | 0.31 | 2.76 | 2.36 |  |
| 2002 | 0.16 | 0.44 | 2.54 | 2.00 |  |
| 2003 | 0.18 | 0.57 | 2.43 | 1.92 |  |
| 2004 | 0.18 | 0.58 | 2.14 | 1.97 |  |
| 2005 | 0.35 | 1.01 | 1.96 | 2.16 |  |
| 2006(b) | 0.70 | 1.39 | 1.83 | 2.09 |  |
| 2007(b) | 0.61 | 1.46 | 1.71 | 2.69 |  |
|  |
| (a) Includes Other Territories - see paragraph 2 of the Explanatory Notes. |
| (b) Estimates of total population growth for 2006 onwards are preliminary and subject to revisions. |
Growth of 0-14 year olds was smallest between 1987-1988 and again more recently from 2002-2005. During 1991-2001 growth was smallest for the 15-39 year age group. Between 1995-2004 the population aged 40-64 years increased the fastest. Growth of the population aged 65 years and over was highest from 1987-1993 and again from 2005 onwards. The large growth rates for the population aged 40 years and over illustrates the ageing of Australia's population as the baby boomer generation moves into the older age groups.
POPULATION GROWTH RATES, Age groups, Australia
- at 30 June 1987-2007

 Print Page
 Print All
 Quality Declaration