|
|
NOTES
ABOUT THIS PUBLICATION
This publication contains statistics of taxation revenue collected by all levels of government in Australia for the period 1998-99 to 2003-04. The taxation revenue statistics presented are for the general government sector and include taxes received from public corporations (i.e. government owned/controlled corporations). The amount of taxes received from these corporations is provided in the relevant tables.
TERMINOLOGY
Wherever the term 'state' is used, this term includes the two territories. Therefore, 'state' refers to 'state and territory' and 'state and local' refers to 'state, territory and local'.
INQUIRIES
For further information about these and related statistics, contact the National Information and Referral Service on 1300 135 070 or Robert Bourke on Canberra (02) 6252 7589.
SUMMARY OF FINDINGS
TOTAL TAXATION REVENUE
Summary
A distinctive feature of the Australian federal system is that the Commonwealth government levies and collects all income tax, from individuals as well as from enterprises. It also collects a portion of other taxes, including taxes on the provision of goods and services. The revenue base of state governments consists of taxes on property, on employers' payrolls, and on the provision and use of goods and services. The sole source of taxation revenue for local governments is taxes on property.
Total taxation revenue collected in Australia rose $19,103 million, 8.0%, between 2002-03 and 2003-04. Taxes on income increased by $10,789 million and taxes on the provision of goods and services increased $3,574 million.
TOTAL TAXATION REVENUE |
|  |
 | 1998-99 | 1999-2000 | 2000-01 | 2001-02 | 2002-03 | 2003-04 |  |
 | $m | $m | $m | $m | $m | $m |  |
COMMONWEALTH GOVERNMENT |  |
|  |
| Taxes on income | 104,060 | 114,520 | 120,861 | 119,032 | 131,278 | 142,067 |  |
| Employers' payroll taxes | 3,376 | 3,521 | 3,577 | 3,831 | 3,085 | 3,658 |  |
| Taxes on property | 5 | 10 | 12 | 12 | 13 | 13 |  |
| Taxes on the provision of goods and services | 33,246 | 34,365 | 50,186 | 53,883 | 59,371 | 62,646 |  |
| Taxes on the use of goods and performance of activities | 412 | 453 | 670 | 722 | 757 | 811 |  |
| Total taxation revenue | 141,100 | 152,869 | 175,306 | 177,481 | 194,504 | 209,195 |  |
STATE GOVERNMENTS |  |
|  |
| Taxes on income | - | - | - | - | - | - |  |
| Employers' payroll taxes | 8,447 | 8,951 | 9,503 | 9,675 | 10,158 | 10,839 |  |
| Taxes on property | 10,716 | 12,090 | 12,411 | 12,434 | 14,166 | 16,683 |  |
| Taxes on the provision of goods and services | 6,172 | 6,576 | 5,987 | 6,548 | 6,977 | 7,275 |  |
| Taxes on the use of goods and performance of activities | 10,100 | 10,276 | 4,776 | 4,685 | 5,105 | 5,597 |  |
| Total taxation revenue | 35,435 | 37,893 | 32,677 | 33,342 | 36,406 | 40,394 |  |
LOCAL GOVERNMENTS |  |
|  |
| Taxes on income | - | - | - | - | - | - |  |
| Employers' payroll taxes | - | - | - | - | - | - |  |
| Taxes on property | 5,725 | 6,017 | 6,394 | 6,758 | 7,215 | 7,663 |  |
| Taxes on the provision of goods and services | - | - | - | - | - | - |  |
| Taxes on the use of goods and performance of activities | - | - | - | - | - | - |  |
| Total taxation revenue | 5,725 | 6,017 | 6,394 | 6,758 | 7,215 | 7,663 |  |
ALL LEVELS OF GOVERNMENT |  |
|  |
| Taxes on income | 104,060 | 114,520 | 120,861 | 119,032 | 131,278 | 142,067 |  |
| Employers' payroll taxes | 11,444 | 12,107 | 12,702 | 13,097 | 12,796 | 14,027 |  |
| Taxes on property | 16,438 | 18,105 | 18,809 | 19,192 | 21,383 | 24,346 |  |
| Taxes on the provision of goods and services | 39,419 | 40,941 | 56,173 | 60,431 | 66,348 | 69,922 |  |
| Taxes on the use of goods and performance of activities | 10,511 | 10,727 | 5,445 | 5,407 | 5,859 | 6,405 |  |
| Total taxation revenue | 181,873 | 196,400 | 213,990 | 217,160 | 237,664 | 256,767 |  |
|  |
| - nil or rounded to zero (including null cells) |
Taxes on income totalled $142,067 million in 2003-04 and comprised 55.3% of total taxation revenue for all levels of government. Taxes on the provision of goods and services, including goods and services tax (GST), totalled $69,922 million in 2003-04 and comprised 27.2% of total taxation revenue for all levels of government.
Commonwealth Government Taxation Revenue
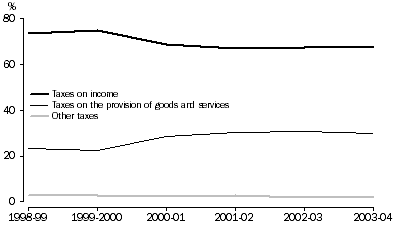
Commonwealth government taxation revenue, including taxes from other levels of government and Commonwealth public corporations, rose 7.6% from $194,504 million in 2002-03 to $209,195 million in 2003-04. In 2003-04, Commonwealth taxation represented 81.5% of taxation revenue for all levels of government. The following graph shows the changing proportions of different taxation revenue categories to total taxation revenue for the Commonwealth government since the introduction of accrual accounting in ABS statistics in 1998-99. In ABS government finance statistics (GFS) and taxation revenue statistics, GST is recorded as a Commonwealth government tax.
PERCENTAGE OF COMMONWEALTH GOVERNMENT TAXATION REVENUE

State Government Taxation Revenue
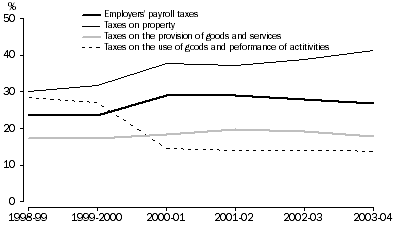
State government taxation revenue (excluding GST revenue - which is recorded in GFS as a grant from the Commonwealth to the states - but including taxes from other levels of government and on public corporations) increased 11.0% from $36,406 million in 2002-03 to $40,394 million in 2003-04. Taxes on property were the single largest taxation revenue source (41.3%) for state governments in 2003-04, followed by employers' payroll taxes at 26.8%. The following graph shows the changing proportions of the different taxation revenue categories to total taxation revenue for the state governments since the introduction of accrual accounting in ABS statistics in 1998-99.
PERCENTAGE OF STATE GOVERNMENT TAXATION REVENUE

Local Government Taxation Revenue
Local government taxation revenue increased 6.2% from $7,215 million in 2002-03 to $7,663 million in 2003-04. Taxes on property are the sole source of taxation revenue for local governments.
Major Components of Total Taxation
Income taxes levied on individuals in 2003-04 represented 38.5% of total taxation revenue for all levels of government.
GST revenue represented 13.3% of total taxation revenue for all levels of government. Excises and levies represented a further 8.5% of total taxation revenue.
MAJOR COMPONENTS OF TOTAL TAXATION, All levels of government |
|  |
 |  |  | 1998-99 | 1999-2000 | 2000-01 | 2001-02 | 2002-03 | 2003-04 |  |
 |  |  | % | % | % | % | % | % |  |
|  |
 |  |  |  |  |  |  |  |
 | Taxes on income |  |  |  |  |  |  |  |
 |  | Income taxes levied on individuals | 42.6 | 42.7 | 36.2 | 39.7 | 38.5 | 38.5 |  |
 |  | Income taxes levied on enterprises(a) | 14.0 | 15.0 | 19.7 | 14.6 | 16.3 | 16.4 |  |
 |  | Income taxes levied on non-residents(b) | 0.6 | 0.6 | 0.6 | 0.5 | 0.5 | 0.4 |  |
 | Employers payroll taxes |  |  |  |  |  |  |  |
 |  | General taxes (payroll tax) | 4.5 | 4.4 | 4.3 | 4.3 | 4.1 | 4.1 |  |
 |  | Selective payroll taxes (stevedoring industry charges) | - | - | - | - | - | - |  |
 |  | Other employers labour force taxes | 1.8 | 1.7 | 1.6 | 1.7 | 1.2 | 1.4 |  |
 | Taxes on property |  |  |  |  |  |  |  |
 |  | Taxes on immovable property | 4.4 | 4.3 | 4.2 | 4.4 | 4.4 | 4.5 |  |
 |  | Taxes on financial and capital transactions | 4.6 | 4.9 | 4.6 | 4.5 | 4.6 | 5.0 |  |
 | Taxes on provision of goods and services |  |  |  |  |  |  |  |
 |  | General taxes (sales tax) | 8.3 | 8.0 | 0.9 | 0.4 | 0.4 | 0.4 |  |
 |  | Goods and services tax (GST) | - | - | 11.1 | 12.6 | 13.2 | 13.3 |  |
 |  | Excises and levies | 8.0 | 7.6 | 9.2 | 9.4 | 9.1 | 8.5 |  |
 |  | Taxes on international trade | 2.0 | 1.9 | 2.2 | 2.4 | 2.3 | 2.2 |  |
 |  | Taxes on gambling | 2.3 | 2.3 | 1.7 | 1.7 | 1.6 | 1.6 |  |
 |  | Taxes on insurance | 1.1 | 1.1 | 1.1 | 1.3 | 1.3 | 1.3 |  |
 | Taxes on the use of goods and performance of activities |  |  |  |  |  |  |  |
 |  | Motor vehicle taxes | 2.2 | 2.0 | 1.9 | 2.0 | 2.0 | 2.0 |  |
 |  | Franchise taxes | 3.1 | 3.0 | 0.2 | - | - | - |  |
 |  | Other | 0.5 | 0.5 | 0.5 | 0.5 | 0.5 | 0.5 |  |
 | Total | 100.0 | 100.0 | 100.0 | 100.0 | 100.0 | 100.0 |  |
|  |
| - nil or rounded to zero (including null cells) |
| (a) Amounts collected under petroleum resource rent taxes are included in income taxes levied on enterprises |
| (b) From 2001-02, withholding taxes on non-residents are no longer separately identifiable under the PAYG system. The values for 2001-02 and subsequent years are estimates based on methodologies developed by the Balance of Payments area within the ABS. |
MAJOR FACTORS AFFECTING TAXATION REVENUE IN 2003-04
The amount of taxation revenue collected in a particular year can be affected by a number of factors, including:
- a change in the rate of a tax or levy;
- the introduction or abolition of a tax or levy;
- one-off special payments;
- additional or fewer collection periods during the financial year;
- changes to payment arrangements; and
- other factors such as economic conditions, population growth, etc.
Major factors affecting taxation revenue in 2003-04 are outlined below. This information has been derived from budget outcomes and annual reports published for the Commonwealth and state governments.
Commonwealth Government
Taxes on Income
- Income taxes levied on individuals rose by $7.5 billion or 8.2%. This increase is largely due to a $5.5 billion growth in income tax withholding receipts.
- Company income tax rose $2.4 billion or 6.9% because of increased company profitability.
- Income tax paid by superannuation funds increased by $870 million or 24.1%, due mainly to the one-off decision by the Commonwealth to extinguish $610 million of existing superannuation liabilities.
Taxes on Employers Payroll and Labour Force
- Other employer labour force taxes rose $573 million or 18.6%, reflecting a $445 million (15.7%) increase in fringe benefits tax combined with a $128 million (50.6%) increase in the superannuation guarantee levy charge. The growth in fringe benefits tax is partly due to the updated assessment of liabilities in respect of employee benefit arrangements and other similar schemes. This resulted in a one-off reduction in revenue in 2002-03. The increases in the superannuation guarantee charge have resulted in increased audit activity.
Taxes on the provision of goods and services
- Goods and services tax revenue rose almost $2.9 billion or 9.2%.
- Revenue from excises rose $258 million or 1.2%.
- General taxes on provision of goods and services (other than GST revenue) increased by $106 million or 11.8%, largely driven by a largely $74 million increase in luxury car tax.
State Governments
Taxes on Employers Payroll and Labour Force
- The taxes on employers' payroll and labour force increased in 2003-04 by $681 million or 6.7%. Tax revenue from employers' payroll taxes increased across all states with the exception of the Northern Territory where they fell for the second consecutive year. The largest increase occurred in New South Wales where an increase of $230 million or 5.6% was recorded. Queensland and Western Australia also recorded increases in excess of $100 million.
Taxes on property
- Taxes on property increased across all states by $2,517 million or 17.8% reflecting similar percentage increases in taxes on immovable property and taxes on financial and capital transactions.
- Taxes on immovable property increased by $627 million or 19.7% with $506 million of the increase due to increased revenue from land taxes.
- Stamp duty on conveyances increased by $1,682 million and accounted for almost 90% of the $1,890 million increase from taxes on financial and capital transactions. Revenue from stamp duty on conveyances increased in all states.
- Taxation revenue from other stamp duties on financial and capital transactions increased by $169 million or 12.5% with increases recorded across all states except new South Wales.
Taxes on the provision of goods and services
- Taxes on the provision of goods and services increased by $298 million or 4.2%.
- Taxes on gambling increased by $197 million or 5.1% across all states
- $154 million (or just under half the increase in total state revenue from taxes on the provision of goods and services) of the increase came from taxes on gambling machines.
- Taxes on insurance rose $99 million or 3.2% with increases occurring in all states except New South Wales.
Taxes on use of goods and peformance of activities
- Taxes on use of goods and performance of activities increased across most states. Almost ninety percent of the $492 million or 9.6% increase was due to an increase in motor vehicle taxes, which rose $436 million.
TAXATION AS A PROPORTION OF GROSS DOMESTIC PRODUCT (GDP)
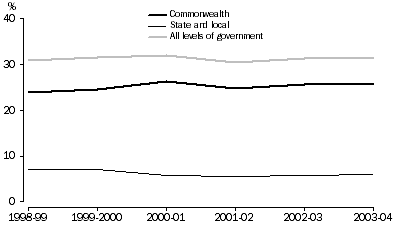
Total taxation revenue as a percentage of GDP increased from 31.3% to 31.6%. Taxation revenue for the Commonwealth Government as a percentage of GDP remained unchanged at 25.7%, while total taxation revenue from state and local governments rose from 5.8% of GDP in 2002-03 to 5.9% in 2003-04.
TAXATION REVENUE AS A PERCENTAGE OF GDP

PER CAPITA TAXATION
On average, Australian residents each paid $12,841 in tax in 2003-04, up 6.8% on the previous year.
The Commonwealth Government taxation per capita rose by 6.3% from $9,844 in 2002-03 to $10,462 in 2003-04.
State and territory governments and local councils charged residents an average of $2,402 a year in property taxes, stamp duty, gambling taxes, payroll and other taxes in 2003-04. This was up from $2,206 in 2002-03.
Of the individual states and territories Western Australia recorded the largest increase in taxation per capita. Its taxation per capita rose $364 or 17.0% from $2,139 in 2002-03 to $2,503 in 2003-04. Western Australia now has the second highest average taxation per capita across the eight states and territories and is second only to New South Wales.
New South Wales taxation per capita was $2,597 in 2003-04, up 4.9% from 2002-03.
Taxation per capita in the Northern Territory rose $99 between 2002-03 to 2003-04, from $1,497 to $1,582.
The amount of taxation per head of resident population, by jurisdiction, is shown in the table below.
TAXATION PER CAPITA(a) |
|  |
 |  |  | 1998-99 | 1999-2000 | 2000-01 | 2001-02 | 2002-03 | 2003-04 |  |
 |  |  | $ | $ | $ | $ | $ | $ |  |
|  |
| Level of Government |  |  |  |  |  |  |  |
 | State and Local |  |  |  |  |  |  |  |
 |  | New South Wales | 2,530 | 2,676 | 2,374 | 2,338 | 2,476 | 2,597 |  |
 |  | Victoria | 2,270 | 2,379 | 2,123 | 2,176 | 2,285 | 2,455 |  |
 |  | Queensland | 1,683 | 1,760 | 1,529 | 1,671 | 1,864 | 2,128 |  |
 |  | South Australia | 1,952 | 2,144 | 1,818 | 1,836 | 2,018 | 2,278 |  |
 |  | Western Australia | 2,097 | 2,174 | 1,886 | 1,908 | 2,139 | 2,503 |  |
 |  | Tasmania | 1,711 | 1,781 | 1,508 | 1,475 | 1,558 | 1,698 |  |
 |  | Northern Territory | 1,989 | 2,013 | 1,307 | 1,392 | 1,497 | 1,596 |  |
 |  | Australian Capital Territory | 2,013 | 2,201 | 2,014 | 1,808 | 2,120 | 2,329 |  |
 |  | Average | 2,186 | 2,305 | 2,025 | 2,052 | 2,206 | 2,402 |  |
 | Commonwealth Government | 7,498 | 8,028 | 9,091 | 9,088 | 9,844 | 10,462 |  |
 | All levels of government | 9,664 | 10,314 | 11,098 | 11,119 | 12,029 | 12,841 |  |
|  |
| (a) Estimated Residential Population data used in this table is sourced from Australian Demographic Statistics (ABS cat. no 3101.0). Details of the calculations are in paragraphs 13 and 14 of the Explanatory Notes section. |
|
 Print Page
 Print All