NOTES
FORTHCOMING ISSUES
| ISSUE (QUARTER) | Release Date |
| March 2010 | 25 May 2010 |
| June 2010 | 24 August 2010 |
DATA NOTES
Some revisions have been made to the data presented for the September 2009 quarter resulting from an observed change in the reporting of bulk wine sales between the June 2009 quarter and September 2009 quarter; however, the total impact is unquantifiable. Movements between subsequent quarters are unaffected but users should view the movements between the June 2009 quarter and September 2009 quarter with caution.
From the September quarter 2009, data relating to the export of Australian produced wine is no longer included in this publication. Information regarding export data can be obtained by contacting the National Information and Referral Service on 1300 135 070.
Further information on domestic sales and imports data is available by downloading the time-series (original) spreadsheets:
- 1. Domestic Sales of Australian Wine, by container type
- 2. Domestic Sales of Australian Wine and Brandy by Winemakers
- 3. Domestic Sales of Australian Fortified Wine by Winemakers
- 4. Imports cleared, by wine type
- 5. Imports cleared, by selected countries
ROUNDING
Where figures have been rounded, discrepancies may occur between sums of the component items and totals.
INQUIRIES
For further information about these and related statistics, contact the National Information and Referral Service on 1300 135 070 or Paul Sutcliffe on Adelaide (08) 8237 7302.
SUMMARY COMMENTARY
AUSTRALIAN TABLE WINE SALES
Total White and Red/Rosé Table Wine
For the December quarter 2009 the original estimate for white table wine was 61.8 million litres, 15.0% higher than last quarter and 4.8% higher than December quarter 2008. The original estimate for red/rosé table wine in December quarter 2009 was 48.4 million litres, 2.2% lower than September quarter 2009 but 11.3% higher than December quarter 2008.
Table Wine, Glass Containers Less Than 2 Litres
In December quarter 2009 the original estimate for white table wine in glass containers less than 2 litres was 33.1 million litres, 32.6% higher than September quarter 2009 and 6.8% higher than December quarter 2008. The original December quarter 2009 estimate for red/rosé table wine in glass containers less than 2 litres was 28.5 million litres, 0.8% higher than September quarter 2009 and 5.6% higher than December quarter 2008.
Table Wine, Soft Pack Containers
The December quarter 2009 original estimate for white table wine in soft pack containers was 25.5 million litres, 1.1% higher than September quarter 2009 and 7.6% lower than December quarter 2008. The original estimate for red/rosé table wine in soft packs for December quarter 2009 was 12.4 million litres, 27.6% lower than September quarter 2009 and 13.6% lower than December quarter 2008.
Table 1. DOMESTIC SALES OF AUSTRALIAN WINE, by container type |
|
 | | WHITE TABLE WINE | RED AND ROSE TABLE WINE | | | |
| | Glass
less than
2 litres | Soft
packs(a) | Total(b) | Glass
less than
2 litres | Soft
packs(a) | Total(b) | Total
table
wine | Total
other
wine | Total
wine |
| Period | '000 L | '000 L | '000 L | '000 L | '000 L | '000 L | '000 L | '000 L | '000 L |
|
| 2006-07 | 100 391 | 116 196 | 218 566 | 102 126 | 57 276 | 162 106 | 380 672 | 67 471 | 448 142 |
| 2007-08 | 93 934 | 110 367 | 206 810 | 95 581 | 55 336 | 155 193 | 362 003 | 65 514 | 427 516 |
| 2008-09 | 96 650 | 104 362 | 204 222 | 96 243 | 56 002 | 159 046 | 363 268 | 66 620 | 429 886 |
| 2008 | | | | | | | | | |
| December Quarter | 30 980 | 27 532 | 58 959 | 27 010 | 14 354 | 43 500 | 102 459 | 23 158 | 125 616 |
| 2009 | | | | | | | | | |
| March Quarter | 21 366 | 24 969 | 47 203 | 18 660 | 11 048 | 30 475 | 77 678 | 12 570 | 90 248 |
| June Quarter | 21 409 | 24 743 | 47 386 | 24 890 | 14 224 | 39 747 | 87 133 | 14 630 | 101 763 |
| September Quarter | r24 939 | 25 171 | r53 694 | r28 302 | 17 109 | r49 512 | r103 205 | r19 393 | r122 599 |
| December Quarter | 33 081 | 25 452 | 61 764 | 28 535 | 12 395 | 48 403 | 110 167 | 27 056 | 137 223 |
|
| r revised |
| (a) Soft pack containers include all collapsible packs, plastic or otherwise. |
| (b) Components do not add to total. The difference between components and totals is 'Wine in other containers' (see Glossary). |
Table 2. DOMESTIC SALES OF WINE AND BRANDY BY WINEMAKERS |
|
| | Table | Fortified | Sparkling - Bottle
fermentation(a) | Sparkling - Bulk
fermentation(a) | Carbonated | Other wine products(b) | Brandy(c) |
| Period | '000 L | '000 L | '000 L | '000 L | '000 L | '000 L | '000 L |
|
| 2006-07 | 380 672 | 17 387 | 23 266 | 16 617 | 7 080 | 3 118 | 510 |
| 2007-08 | 362 003 | 17 183 | 21 655 | 14 939 | 8 479 | 3 258 | 508 |
| 2008-09 | r363 268 | 16 283 | 20 770 | 15 745 | 9 726 | 4 090 | 486 |
| 2008 | | | | | | | |
| December Quarter | 102 459 | 4 059 | 8 665 | 6 476 | 2 956 | 1 000 | 153 |
| 2009 | | | | | | | |
| March Quarter | 77 678 | 3 084 | 3 693 | 2 547 | 2 122 | 1 122 | 89 |
| June Quarter | 87 133 | 4 341 | 3 467 | 3 181 | 2 688 | 953 | 117 |
| September Quarter | r103 205 | r4 521 | 4 660 | 6 155 | 3 192 | 866 | 118 |
| December Quarter | 110 167 | 4 305 | 8 022 | 8 238 | 4 907 | 1 584 | 147 |
|
| r revised |
| (a) Spritzig table wines are included in table wine. |
| (b) See Glossary. |
| (c) Quantities on which excise duty was paid. |
Table 3. DOMESTIC SALES OF AUSTRALIAN FORTIFIED WINE BY WINEMAKERS |
|
| | Sherry in
glass less
than 2 litres | Port in
glass less
than 2 litres | Other in
glass less
than 2 litres(a) | Soft
packs(b) | All other
containers(c) | Total
fortified
wine |
| Period | '000 L | '000 L | '000 L | '000 L | '000 L | '000 L |
|
| 2006-07 | 1 662 | 3 452 | 440 | 7 865 | 3 973 | 17 387 |
| 2007-08 | 1 802 | 3 429 | 401 | 7 330 | 4 217 | 17 183 |
| 2008-09 | 1 659 | 3 265 | 361 | 6 790 | 4 208 | 16 283 |
| 2008 | | | | | | |
| December Quarter | np | 878 | np | np | 1 031 | 4 059 |
| 2009 | | | | | | |
| March Quarter | np | 534 | 74 | np | 813 | 3 084 |
| June Quarter | np | 876 | 100 | np | 1 102 | 4 341 |
| September Quarter | np | r917 | 87 | np | 1 165 | r4 521 |
| December Quarter | np | 967 | 170 | np | 1 074 | 4 305 |
|
| np not available for publication but included in totals where applicable, unless otherwise indicated |
| r revised |
| (a) Includes muscat, madiera, tokay and white port. |
| (b) Includes all collapsible packs whether plastic or of other material. |
| (c) Includes tankers, cans and rigid containers including glass 2 litres and over. |
IMPORTS
Wine Imports Cleared for Home Consumption
In original terms, 21.5 million litres of wine valued at $169.7 million were imported in December quarter 2009. This represents an increase of 23.2% in quantity from the previous quarter. The value of imports was 41.2% higher than September quarter 2009. The average value of wine cleared for home consumption in December quarter 2009 was $7.88 per litre up from $6.87 per litre in September quarter 2009.
WINE IMPORTS CLEARED, Original
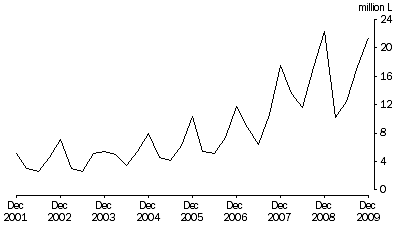
Table 4. IMPORTS CLEARED, by wine type |
|
| Period | White
table | Red/Rosé
table | Table
wine | Fortified
wine | Sparkling
wine | Other
wine | Total
wine |
Quantity ('000 L) |
|
| 2006-07 | 19 003 | 6 487 | 25 490 | 123 | 7 000 | 1 662 | 34 275 |
| 2007-08 | 31 319 | 11 260 | 42 580 | 159 | 8 268 | 2 307 | 53 313 |
| 2008-09 | 41 128 | 9 476 | 50 604 | 192 | 9 591 | 1 843 | 62 230 |
| 2008 | | | | | | | |
| December Quarter | 15 727 | 3 132 | 18 859 | 41 | 2 931 | 489 | 22 321 |
| 2009 | | | | | | | |
| March Quarter | 6 561 | 1 674 | 8 235 | 69 | 1 382 | 541 | 10 227 |
| June Quarter | 7 886 | 1 569 | 9 454 | 54 | 2 597 | 289 | 12 394 |
| September Quarter | 11 610 | 2 652 | 14 262 | 50 | 2 699 | 471 | 17 482 |
| December Quarter | 15 321 | 2 623 | 17 945 | 75 | 2 986 | 536 | 21 542 |
Value (Customs Value) ($'000) |
|
| 2006-07 | 155 180 | 46 720 | 201 900 | 1 154 | 97 533 | 6 437 | 307 023 |
| 2007-08 | 222 578 | 64 581 | 287 158 | 1 523 | 132 353 | 10 450 | 431 485 |
| 2008-09 | 270 564 | 73 706 | 344 271 | 1 529 | 118 910 | 8 635 | 473 345 |
| 2008 | | | | | | | |
| December Quarter | 105 984 | 23 725 | 129 709 | 429 | 46 096 | 2 390 | 178 624 |
| 2009 | | | | | | | |
| March Quarter | 47 875 | 12 380 | 60 255 | 201 | 16 414 | 2 770 | 79 640 |
| June Quarter | 47 451 | 14 682 | 62 133 | 528 | 18 119 | 1 401 | 82 181 |
| September Quarter | 66 337 | 20 854 | 87 190 | 516 | r30 612 | 1 856 | r120 174 |
| December Quarter | 91 829 | 22 301 | 114 130 | 575 | 52 504 | 2 464 | 169 674 |
|
| r revised |
Table 5. IMPORTS CLEARED, by selected countries |
|
| Period | New
Zealand | Italy | France | Portugal | Spain | Chile | Germany | South
Africa | Total other
countries | Total all
countries |
Quantity ('000 L) |
|
| 2006-07 | 18 142 | 5 544 | 5 354 | 482 | 947 | 586 | 901 | 517 | 1 802 | 34 275 |
| 2007-08 | 23 859 | 7 117 | 7 087 | 723 | 1 167 | 4 449 | 557 | 2 527 | 5 828 | 53 313 |
| 2008-09 | 37 014 | 7 467 | 7 010 | 547 | 1 085 | 3 197 | 627 | 2 350 | 2 934 | 62 230 |
| 2008 | | | | | | | | | | |
| December Quarter | 13 150 | 2 237 | 2 467 | 216 | 382 | 1 965 | 178 | 1 088 | 639 | 22 321 |
| 2009 | | | | | | | | | | |
| March Quarter | 6 802 | 1 305 | 895 | 75 | 183 | 116 | 127 | 62 | 662 | 10 227 |
| June Quarter | 8 750 | 1 229 | 969 | 94 | 138 | 148 | 162 | 558 | 346 | 12 394 |
| September Quarter | 12 039 | 2 041 | 1 654 | 156 | 156 | 211 | 130 | 713 | 381 | 17 482 |
| December Quarter | 14 956 | 1 988 | 2 712 | 174 | 495 | 293 | 178 | 402 | 344 | 21 542 |
Value (Customs Value) ($'000) |
|
| 2006-07 | 155 913 | 32 081 | 97 134 | 2 050 | 4 900 | 2 439 | 3 347 | 1 389 | 7 769 | 307 023 |
| 2007-08 | 209 401 | 40 543 | 142 906 | 2 888 | 7 265 | 7 284 | 2 935 | 5 522 | 12 740 | 431 485 |
| 2008-09 | 261 790 | 49 018 | 125 805 | 2 580 | 7 175 | 5 562 | 3 763 | 7 258 | 10 393 | 473 345 |
| 2008 | | | | | | | | | | |
| December Quarter | 101 640 | 15 161 | 47 808 | 960 | 2 247 | 2 632 | 1 156 | 3 376 | 3 643 | 178 624 |
| 2009 | | | | | | | | | | |
| March Quarter | 49 897 | 9 769 | 14 858 | 340 | 1 336 | 599 | 714 | 232 | 1 895 | 79 640 |
| June Quarter | 48 656 | 8 406 | 17 951 | 549 | 1 144 | 656 | 1 068 | 1 693 | 2 058 | 82 181 |
| September Quarter | 67 237 | 13 492 | r30 596 | 791 | 1 375 | 1 068 | 723 | 2 250 | 2 643 | r120 174 |
| December Quarter | 92 342 | 11 973 | 55 806 | 832 | 3 184 | 1 033 | 961 | 1 346 | 2 197 | 169 674 |
|
| r revised |
 Print Page
 Print All