MARCH KEY FIGURES
 | Mar Qtr 2006 | Dec Qtr 2006 | Mar Qtr 2007 |
| CONSOLIDATED ASSETS | $m | $m | $m |
|
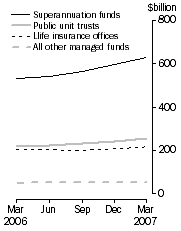
| Superannuation funds | 533 224 | 598 073 | 629 076 |
| Public unit trusts | 219 035 | 244 339 | 256 034 |
| Life insurance offices(a) | 205 340 | 207 928 | 216 819 |
| All other managed funds | 51 428 | 53 346 | 55 296 |
| Total | 1 009 026 | 1 103 687 | 1 157 225 |
|
| (a) Investments by superannuation funds which are held and administered by life insurance offices are included under life insurance offices. |
| See note on consolidation in Explanatory Notes, paragraph 10. |
Consolidated assets,
Type of institution
| Consolidated assets,
Type of asset
|
MARCH KEY POINTS
CONSOLIDATED ASSETS
- Total consolidated assets of managed funds institutions were $1157.2b at 31 March 2007, an increase of $53.5b (4.9%) on the revised December quarter 2006 figure of $1103.7b.
- Consolidated assets of superannuation funds increased by $31.0b (5.2%), public unit trusts were up by $11.7b (4.8%), life insurance offices up by $8.9b (4.3%), cash management trusts up by $1.8b (4.7%) and common funds up by $0.2b (1.7%). Consolidated assets of friendly societies decreased marginally compared to December quarter.
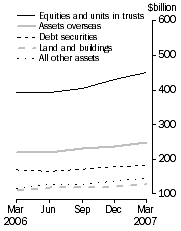
- Increases were recorded in all asset types with the largest increase in equities and units in trusts, up $21.0b (4.9%). The other increases recorded were assets overseas, up $13.5b (5.7%), cash and deposits, up $6.2b (8.0%), land and buildings, up $5.8b (4.8%), short term securities, up $2.7b (3.1%), other assets, up $1.6b (4.9%), long-term securities, up $1.4b (1.5%) and loans and placements, up $1.3b (4.9%). During the March quarter 2007, the S&P/ASX 200 rose 5.7%, the price of foreign shares (represented by the US S&P 500) rose 0.2% and the $A appreciated against the $US by 2.0%. In addition the 5 year Treasury Bond yield, averaged over the three months within the quarter, increased from 5.90% to 6.00%.
- Investment managers had $1095.5b in funds under management at 31 March 2007, up $42.9b (4.1%) on the revised December quarter 2006 figure of $1052.6b. They managed $780.0b (67.4%) of the consolidated assets of managed funds institutions.
NOTES
FORTHCOMING ISSUES
| ISSUE (QUARTER) | Release Date |
| June 2007 | 30 August 2007 |
| September 2007 | 29 November 2007 |
| December 2007 | 28 February 2008 |
| March 2008 | 29 May 2008 |
| June 2008 | 28 August 2008 |
REVISIONS IN THIS ISSUE
There have been revisions in some series back to June quarter 2005 as a result of quality assurance work undertaken with data providers and the receipt of revised administrative data.
CHANGES TO THIS ISSUE
Public unit trusts have been included in the Key Figures. The total consolidated assets chart has been replaced by two charts providing greater detail (by type of institution and type of asset).
SUPERANNUATION
Legislation changes announced in 2006 made it favourable for people over 50 to contribute up to $1m to their superannuation before 1 July 2007. The superannuation estimates presented in this publication measure the assets of superannuation funds at the end of each quarter. These assets can increase or decrease for a number of reasons including market price changes and net contribution and benefit payments.
New contributions made to superannuation funds reporting to the Australian Prudential Regulation Authority (regulated superannuation funds) or the ABS Survey of Financial Information should be captured in the quarterly estimates of total assets included in this publication. No significant increase in assets of superannuation funds are apparent in March quarter 2007 estimates. The self-managed super funds regulated by Australian Taxation Office (ATO) report annually and compilation methods are used to create quarterly estimates. If the legislation changes result in a significant increase in contributions, these compilation methods may not fully reflect the increase until new annual data become available.
ROUNDING
Discrepancies may occur between sums of the component items and totals due to rounding.
INQUIRIES
For further information about these and related statistics, contact the National Information and Referral Service on 1300 135 070 or Sawbhag Naidu on Canberra (02) 6252 5386.
 Print Page
 Print All