HOME OWNERS AND RENTERS
The legal rights and obligations that households have in relation to the dwelling in which they live vary considerably according to tenure type. For example, those who own their home have greater security of tenure than most renters whose occupancy rights are subject to review at relatively frequent intervals. Owners also have more freedom than renters to modify the dwelling to suit their specific needs and tastes, to keep pets, take in boarders or run a business from home. In the course of repaying their home loans, owners accumulate wealth in the form of home equity which can then be used to secure finance for other purposes.
On the other hand, renting can have advantages over home ownership, such as greater flexibility to move elsewhere at short notice, lower housing costs than many owners repaying a mortgage, and the opportunity to invest in other assets which may yield higher returns than home ownership. Households renting from a state or territory government housing authority (public renters) generally enjoy lower housing costs and greater security of tenure than those renting from a private landlord.
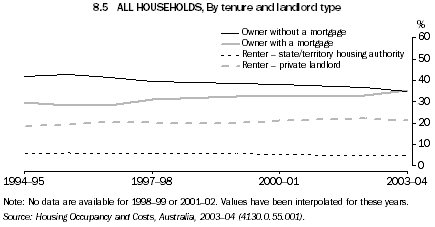
At the 1947 Population Census, 53% of all occupied private dwellings were either owned or being purchased by their occupants. By 1961, the home ownership rate had risen to 70% and has remained at about that level since. In 2003-04, 35% of households owned their homes outright (i.e. without a mortgage) and 35% were owners with a mortgage. A further 21% were renting from a private landlord and 5% were renting from a state or territory housing authority.
Since 1994-95, the proportion of households renting from state/territory housing authorities has declined slightly while the proportion renting privately has increased from 18% to 21% (graph 8.5). While a greater proportion of all renting households are renting from private landlords, there is an increased number of private renters receiving Commonwealth Rent Assistance. (see Housing costs and Housing assistance). Among home owners, the proportion without a mortgage has declined from 42%, while the proportion with a mortgage has risen from 30%, to converge at 35% in 2003-04. The decline in outright home ownership may reflect increasing uptake of flexible low-cost financing options which allow households to extend their existing home mortgages for purposes other than the original home purchase (see Home buyers).
Australia's preference for a free-standing house on its own block of land is most evident among home owners. Of the 5.4 million households that owned their home in 2003-04, 90% lived in separate houses (graph 8.7). Over a half (55%) of all renter households lived in separate houses; 29% lived in flats, units or apartments; and 15% lived in semi-detached dwellings.
 Print Page