EMPLOYMENT
Commercial art galleries
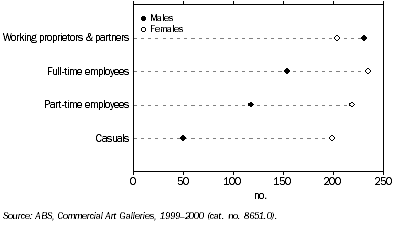
The Survey of Commercial Art Galleries found that there were 1,409 people employed by commercial art gallery businesses at the end of June 2000. Of these, 39% were males and 61% were females. While males had slightly higher numbers than females in the category Working proprietors and partners, they were outnumbered in each of the other categories, with the greatest difference being for casual employees (50 males and 199 females).
14.3 PERSONS EMPLOYED IN COMMERCIAL ART GALLERIES - June 2000
Visual artists and craft workers
Two data sources; the 2001 Census of Population and Housing and the 2004 Work in Selected Culture and Leisure Activities Survey, provide some information on the number of people involved in the creation of visual arts and crafts.
Census of Population and Housing
The 2001 Census of Population and Housing does not separately identify a visual arts and crafts industry, treating it as a subset of the broader Creative arts industry. The Creative arts industry comprises those who are self employed and includes writers, composers and a variety of occupations which rely on creative expression. Selecting specific occupations gives an indication of the number of people undertaking visual art and craft activity as their main job in the week before the Census.
Some of the more common visual arts and crafts occupations in the Creative arts industry in 2001 were Visual arts painters (1,735 people) and Designers and illustrators (566 people). The data indicates that other industries also employed creative artists.
Details of the total number of people working in visual art and craft occupations in all industries are provided in Chapter 5.
14.4 SELECTED CULTURAL OCCUPATIONS IN THE CREATIVE ARTS INDUSTRY(a) - August 2001 |
|
| Selected cultural occupations | Number of persons |
|
| Painters (visual arts) | 1 735 |
| Designers and illustrators | 566 |
| Visual arts and crafts professionals, n.e.c. or n.f.d. | 503 |
| Sculptors | 371 |
| Potters and ceramic artists | 113 |
| Total selected cultural occupations | 3 288 |
|
| (a) In their main job in the week before Census Night. |
| ABS, Employment in Culture, Australia, 2001 (cat. no. 6273.0). |
Work Survey
The Census only collects information on a person's main job during a one week period in August 2001. However, the 2004 Survey of Work in Selected Culture and Leisure Activities shows that less than a quarter of artists and craftworkers received payment for their creations in the 12 months before interview.
Many would therefore be unlikely to indicate art and craftwork as their main job in the Census, more likely nominating the activity that provides the largest income. The Work survey is perhaps a better indicator of the Australian level of involvement in visual art and craft, as it includes both paid and unpaid involvement and involvement over a 12-month period.
It should be noted that hobby activity is excluded - that is, only those people involved in the production of works which are available for sale or public display are covered.
During the 12 months prior to interview in April 2004, an estimated 789,900 people aged 15 years and over were involved in visual arts, while 542,700 were involved in craft. Female involvement was higher for virtually all types of art and craft work, the exception being furniture-making and wood craft.
People most likely to be paid for their visual arts and craft work were those involved in print-making, although the number undertaking this activity was relatively small.
14.5 Persons involved, By type of activity and payment status - 2004 |
|
 | | Some
paid involvement | Unpaid
involvement only | Total(a) | Percentage with some
paid involvement(b) |
| | '000 | '000 | '000 | % |
|
| Visual art activities | | | | |
| Computer art | 82.5 | 200.4 | 286.3 | 29.1 |
| Painting | 38.8 | 220.1 | 262.4 | 15.0 |
| Photography | 59.2 | 236.6 | 300.1 | 20.0 |
| Drawing | 46.0 | 239.1 | 288.7 | 16.1 |
| Sculpture | *8.7 | 51.8 | 61.5 | *14.4 |
| Print-making | 20.5 | 44.8 | 68.4 | 31.4 |
| Other visual art | *10.0 | 35.4 | 47.8 | *22.0 |
| Total visual art activities(c) | 183.1 | 597.1 | 789.9 | 23.5 |
| Craft activities | | | | |
| Furniture-making and wood crafts | 51.5 | 151.5 | 204.5 | 25.4 |
| Textiles | 21.1 | 120.7 | 144.3 | 14.9 |
| Pottery and ceramics | *11.9 | 42.7 | 57.6 | *21.8 |
| Jewellery | 18.9 | 43.0 | 63.5 | 30.6 |
| Glass crafts | *5.3 | 20.9 | 27.0 | *20.1 |
| Other craft activities | 17.6 | 97.7 | 122.1 | 15.3 |
| Total craft activities(c) | 117.0 | 414.9 | 542.7 | 22.0 |
|
| * estimate has a relative standard error of 25% to 50% and should be used with caution |
| (a) Includes some persons for whom payment details are not known. |
| (b) Percentage calculated from the total of those where payment status was known. |
| (c) Components may not add to total as some persons were involved in more than one activity. |
| ABS, Work in Selected Culture and Leisure Activities, Australia, April 2004 (cat. no. 6281.0). |
 Print Page
 Print All