|
|
Underutilised labour: Labour Force Transitions
In 2004, a greater proportion of young people changed labour force status from one month to the next, compared with prime working or mature aged people.
People move between differing roles throughout their lives, such as student, parent, wage-earner, householder, and retired person. Many changes in role are accompanied by a change in labour force status, such as when a young person moves from full-time study to employment. People move between employment, unemployment and being out of the labour force as well as moving between jobs.
In 2004, the average annual unemployment rate for men and women aged 15-64 years was 5.5% and 5.7% respectively. While the unemployment rate overall may not change greatly from one month to the next, there is a reasonable amount of change in the actual people who are unemployed in those two months. There are similar patterns for those people who are employed or not in the labour force.
Analysis of labour force transition data provides insight, for particular groups of people, into the month to month changes not apparent in movement estimates. This article focuses on month to month transitions in labour force status of young workers (aged 15-24 years), prime working aged workers (aged 25-44 years) and mature aged workers (aged 45-64 years).
TRANSITIONS IN LABOUR FORCE STATUS
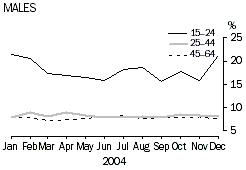
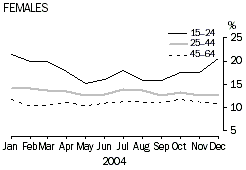
In 2004, most people maintained the same labour force status from one month to the next. A larger proportion of younger people (aged 15-24 years) changed their status than older people. Averaging across 2004, a greater proportion of young men (18%) than prime working aged or mature aged men (both 8%) changed their labour force status from one month to the next. Similarly, on average, a larger proportion of young women (18%) changed their labour force status than did older women (13% of prime working aged and 11% of mature aged women).
The rise in labour force transitions for young people between November and March coincides with the end of one academic year and the start of another. The relatively high mobility of younger people reflects the relatively high proportions taking short-term employment while studying, and their tendency to experience a variety of jobs before settling on a career path.
On average, in 2004, a smaller proportion of mature aged women changed their labour force status from one month to the next compared with prime working aged women. This may be related to the latter's tendency to be involved in child-rearing where transitions occur to balance work and home life.
Averaged over 2004, for men the most common labour force state to remain in from one month to the next was full-time employment (96%). For women, it was to continue in full-time employment or to remain outside the labour force (both 90%). The most common state from which people moved from one month to the next was unemployment.
Proportion of people changing labour force status - 2004
  Source: Labour Force, Australia, Detailed - Electronic Delivery, monthly (ABS cat. no. 6291.0.55.001).
Labour force status
Data in this article are from the monthly Labour Force Survey (LFS). For the purposes of this article, young people are those aged 15-24 years, prime working aged people are aged 25-44 years, and mature aged people are aged 45-64 years.
In this article, employed people are those aged 15-64 years who worked during the reference week for pay, profit, commission, payment in kind or without pay in a family business, or who had a job but were not at work.
Full-time employed persons includes those who usually work 35 hours or more a week (in all jobs) and others who, although usually working less than 35 hours a week, worked 35 hours or more during the reference week. Part-time employed persons are those who usually work less than 35 hours per week (in all jobs) and who did so during the survey reference week.
Unemployed people are people aged 15-64 years who were not employed during the survey reference week, but were available for work and actively looking for work. The unemployment rate for an age group is the number of unemployed people in that group expressed as a percentage of the labour force (the total number of employed and unemployed people) in that group. The labour force participation rate for an age group is the labour force expressed as a percentage of the civilian population in that age group. |
Transitions in labour force status
Comparisons between labour force transitions of different age groups are made by analysing monthly gross flows data from the Labour Force Survey (LFS). Households selected for the LFS are interviewed over eight consecutive months, with one-eighth of the sample replaced each month. People who respond in two consecutive months form a ‘matched sample’. On average, 80% of people are ‘common’ from one month to the next. About 20% of people cannot be matched due to the one-eight sample replacement, mobility of the population, non-response in either or both surveys and inability to match people in non-private dwellings (e.g. residents of short-stay caravan parks, and Aboriginal and Torres Strait Islander communities). About two-thirds of unmatched people have characteristics similar to those in the matched sample group, but the characteristics of the other one-third are likely to be somewhat different.
These transitions provide a guide to the movements between categories which underlie the changes in monthly levels. Transition data used in this article are annual averages based on monthly matched samples, while totals are based on full LFS estimates. |
...moving from unemployment
Over half of all people aged 15-64 years who were unemployed in one month remained unemployed in the next month (59% of men and 51% of women). A smaller proportion (53%) of young men remained unemployed from one month to the next than men aged 25-44 years (61%) or men aged 45-64 years (64%). This may reflect younger people being more likely to find casual jobs that require low skill levels (see Australian Social Trends 2005, Casual employees). For some young people, these jobs may provide short-term employment while they are studying.
In 2004, the rate of unemployment for mature aged men (annual average of 3.6%) was less than for young men (12.0%). However, older unemployed people often have more difficulty in obtaining work than younger job seekers and are therefore more at risk of remaining unemployed for a long time. (endnote 1)
A greater proportion of unemployed men moved to full-time or part-time employment (23%), while a greater proportion of women withdrew from the labour force (27%) than moved to employment (22%). Some of these women may have temporarily withdrawn from the labour force because they were unavailable or not actively looking for work for a brief period or may have been discouraged from seeking work. Other people may move from being unemployed to not in the labour force for longer-term reasons (for example, undertaking study or retirement).
A greater proportion of unemployed young men entered part-time employment (13%) than did prime working age and mature aged men (9% and 7% respectively). More prime working aged men (15%) gained full-time employment than did young and mature aged men (both 11%). Unemployed women had a greater tendency to gain part-time work (16%) than full-time work (7%).
Three-quarters (75%) of men and almost two-thirds (63%) of women who had been unemployed long-term (52 weeks and over) remained unemployed from one month to the next. Conversely, smaller proportions of shorter-term (less than 52 weeks) unemployed people remained unemployed in the following month (54% of men and 48% of women unemployed in the first month). Many of the moves for long-term unemployed people are between unemployment and being not in the labour force, possibly reflecting discouragement about obtaining a job.
WHETHER MOVED FROM UNEMPLOYMENT - 2004
|
 | Males
| | Females
|
| | | | | | | | | |
| 15-24 | 25-44 | 45-64 | Total | | 15-24 | 25-44 | 45-64 | Total |
|
| Entered(a) | % | % | % | % | | % | % | % | % |
| Full-time employment | 10.6 | 15.4 | 10.7 | 12.4 | | 6.1 | 7.5 | *5.2 | 6.5 |
| Part-time employment | 12.9 | 9.3 | *7.5 | 10.3 | | 17.8 | 14.3 | 14.3 | 15.7 |
| Not in the labour force | 23.2 | 14.4 | 17.7 | 18.7 | | 26.5 | 25.9 | 28.4 | 26.6 |
| Stayed unemployed(a) | 53.2 | 60.9 | 64.1 | 58.6 | | 49.6 | 52.4 | 52.0 | 51.2 |
|
| ‘000 | ‘000 | ‘000 | ‘000 | | ‘000 | ‘000 | ‘000 | ‘000 |
| Total annual | | | | | | | | | |
| average unemployed | 123.1 | 115.5 | 68.3 | 306.9 | | 107.0 | 105.1 | 46.4 | 258.5 |
(a) Proportion of people who were unemployed in month 1 and had the specified labour force status in month 2, averaged across the year.
Source: Labour Force, Australia, Detailed - Electronic Delivery, monthly (ABS cat. no. 6291.0.55.001). |
WHETHER MOVED FROM FULL-TIME EMPLOYMENT - 2004
|
| Males
| | Females
|
| 15-24 | 25-44 | 45-64 | Total | | 15-24 | 25-44 | 45-64 | Total |
|
| Entered(a) | % | % | % | % | | % | % | % | % |
| Part-time employment | 5.4 | 2.1 | 2.5 | 2.6 | | 8.6 | 7.3 | 8.6 | 8.0 |
| Unemployment | 1.6 | 0.6 | 0.4 | 0.6 | | *1.1 | *0.4 | *0.3 | 0.5 |
| Not in the labour force | 1.7 | 0.8 | 1.1 | 1.0 | | 1.5 | 1.5 | 1.4 | 1.5 |
| Stayed in full-time employment(a) | 91.3 | 96.5 | 96.1 | 95.7 | | 88.8 | 90.8 | 89.6 | 90.1 |
|
| ‘000 | ‘000 | ‘000 | ‘000 | | ‘000 | ‘000 | ‘000 | ‘000 |
| Total annual average | | | | | | | | | |
| employed full-time | 569.6 | 2,322.3 | 1,613.0 | 4,504.8 | | 389.5 | 1,159.2 | 797.8 | 2,346.6 |
(a) Proportion of people who were in full-time employment in month 1 and had the specified labour force status in month 2, averaged across the year.
Source: Labour Force, Australia, Detailed - Electronic Delivery, monthly (ABS cat. no. 6291.0.55.001). |
...moving from full-time employment
Compared to the 1960s, full-time permanent jobs have declined relative to various non-standard types of employment such as part-time or casual employment which have increased. (endnote 2) In 2004, the vast majority of both men (96%) and women (90%) aged 15-64 years who were employed full-time in one month remained in full-time employment in the next month.
It was less common for young men to remain in full-time employment (91%) than prime working aged (97%) and mature aged (96%) men. This reflects the greater labour force mobility of younger men.
The majority of people who did move from full-time employment moved to part-time employment (3% of men and 8% of women who were in full-time employment). A greater proportion of younger men moved to part-time employment (5%) than prime working (2%) or mature aged (3%) men.
Labour force experience
Information on labour force experience was collected in February 2003 in a supplement to the monthly LFS, the Labour Force Experience Survey. This survey uses a more limited set of questions than the LFS so the terms worked and looked for work are used rather than the more precise employed and unemployed terms of the LFS.
In the year ending February 2003, over three-quarters (78%) of Australians aged 15-69 years either worked or looked for work at some time during the year. Over half (57%) of the men and 42% of the women worked for the whole year. Some people worked for part of the year and looked for work for the rest of the year (6% of men and 4% of women). Others were not in the labour force for the entire year - over one-quarter (28%) of women and nearly one-sixth (15%) of men.
For more details regarding the Labour Force Experience Survey, see Labour Force Experience (ABS cat. no. 6206.0). |
WHETHER MOVED FROM PART-TIME EMPLOYMENT - 2004
|
| Males
| | Females
|
| 15-24 | 25-44 | 45-64 | Total | | 15-24 | 25-44 | 45-64 | Total |
| Entered(a) | % | % | % | % | | % | % | % | % |
| Full-time employment | 10.1 | 25.9 | 20.3 | 17.1 | | 8.4 | 10.3 | 10.8 | 10.1 |
| Unemployment | 3.6 | 3.8 | *2.3 | 3.3 | | 2.3 | 1.1 | *0.8 | 1.3 |
| Not in the labour force | 8.5 | 4.6 | 6.8 | 7.0 | | 6.3 | 5.7 | 5.2 | 5.6 |
| Stayed in part-time employment(a) | 77.9 | 65.7 | 70.6 | 72.6 | | 83.0 | 83.0 | 83.2 | 83.0 |
|
| ‘000 | ‘000 | ‘000 | ‘000 | | ‘000 | ‘000 | ‘000 | ‘000 |
| Total annual average | | | | | | | | | |
| employed part-time | 331.2 | 203.3 | 201.9 | 736.4 | | 462.9 | 825.7 | 627.5 | 1,916.1 |
(a) Proportion of people who were in part-time employment in month 1 and had the specified labour force status in month 2, averaged across the year.
Source: Labour Force, Australia, Detailed - Electronic Delivery, monthly (ABS cat. no. 6291.0.55.001). |
...moving from part-time employment
For some people seeking to balance work and non-work activities, part-time employment is desirable. Both men and women mature age workers are more likely to work part-time as they approach retirement age, and this appears to be largely by choice. On average in 2004, almost fourth-fifths (79%) of mature aged part-time workers did not want to work more hours.
For others, part-time employment may be seen as a stepping stone to full-time employment with, in some cases, a part-time job easier to find than a full-time job. Financial pressure may induce people to take up casual employment rather than wait for a full-time permanent position. (endnote 3) Other people may work multiple part-time jobs to make up full-time hours (see Australian Social Trends 2005, Casual employees). In 2004, over one-quarter (27%) of part-time workers wanted to work more hours, with a higher proportion of men (35%) wanting more hours than women (24%).
In 2004, most men (73%) and women (83%) who were employed part-time in one month remained in part-time employment in the next month. A greater proportion of women across all three age groups stayed in part-time employment (83%) than men (between 66% and 78%). Over one-quarter (26%) of prime working aged men and one-fifth (20%) of mature aged men who were employed part-time moved from part-time employment to full-time employment. By comparison, around one-tenth (10% and 11%) of both prime working and mature aged women moved from part-time to full-time employment.
...moving from not in the labour force
In 2004, on average there were 3.4 million people aged 15-64 years who were not in the labour force. Interest in these people in this article centres on their potential to participate in the labour force.
On average in 2004, a greater proportion of women were outside the labour force than were men (33% of women and 18% of men aged 15-64 years). Some people not in the labour force are marginally attached to the labour force and want to work, but do not meet the criteria to be unemployed (for example, they may not be available for work in the reference week). In September 2004, over one-fifth (22%) of people not in the labour force were marginally attached to the labour force. (Endnote 4) A small proportion of these marginally attached people were discouraged jobseekers, almost two-thirds (65% in September 2004) of whom were female.
In 2004, the vast majority of people not in the labour force in one month remained outside the labour force in the next month (86% of men and 90% of women). A greater proportion of mature aged men (93%) and women (94%) remained outside the labour force than prime working aged (81% of men and 89% of women) or young people (81% of men and 83% of women). Some mature aged workers might choose to retire, while others, having lost a job, may face difficulties in finding work. Older workers are more likely to become discouraged and drop out of the labour force altogether than people in younger age groups. (endnote 1) Some older discouraged jobseekers may decide to retire rather than to continue to seek employment. Government policies have been introduced to encourage retention of mature age workers in the workforce. These policies have increased the age at which women can access the Age Pension as well as providing incentives for workers to stay on beyond age pension age. (endnote 1)
In 2004, slightly more men than women made themselves available for work by moving from being outside the labour force to being unemployed (6% of men and 4% of women not in the labour force in the first month). The proportion of both men and women moving to unemployment declined with age from levels for young people of 9% of men and 8% of women, to 3% and 2% respectively of mature aged people.
A greater proportion of people outside the labour force moved to employment than to unemployment, with a slightly higher proportion of men moving to full-time employment than women (3% and 1% respectively).
WHETHER MOVED FROM NOT IN THE LABOUR FORCE - 2004
|
| Males
| | Females
|
| 15-24 | 25-44 | 45-64 | Total | | 15-24 | 25-44 | 45-64 | Total |
| Entered (a) | % | % | % | % | | % | % | % | % |
| Full-time employment | 2.6 | 7.0 | 2.6 | 3.4 | | *1.3 | 1.5 | 0.9 | 1.2 |
| Part-time employment | 7.3 | 4.3 | 2.4 | 4.4 | | 7.3 | 5.4 | 3.2 | 4.8 |
| Unemployment | 8.9 | 8.2 | 2.5 | 5.7 | | 8.2 | 3.8 | 1.5 | 3.6 |
| Stayed not in the labour force(a) | 81.2 | 80.6 | 92.5 | 86.5 | | 83.1 | 89.3 | 94.4 | 90.4 |
|
| ‘000 | ‘000 | ‘000 | ‘000 | | ‘000 | ‘000 | ‘000 | ‘000 |
| Total annual average | | | | | | | | | |
| not in the labour force | 403.3 | 259.8 | 544.9 | 1,208.0 | | 423.5 | 854.4 | 958.2 | 2 236.1 |
(a) Proportion of people who were not in the labour force in month 1 and had the specified labour force status in month 2, averaged across the year.
Source: Labour Force, Australia, Detailed - Electronic Delivery, monthly (ABS cat. no. 6291.0.55.001). |
ENDNOTES
1 Australian Bureau of Statistics 2005, Year Book Australia, cat. no. 1301.0, ABS, Canberra.
2 Watson, I, Buchanan, J, Campbell, et al. 2003, Fragmented Futures, The Federation Press, Australia.
3 Chalmers, J, and Kalb, G. 2000, The transition from unemployment to work. Are casual jobs a short cut to permanent employment?, Discussion paper no. 109, Social Policy Research Centre, Sydney.
4 Australian Bureau of Statistics 2005, Persons Not in the Labour Force, Australia, September 2004, cat. no. 6220.0, ABS Canberra.
|
 Print Page
 Print All