SAMPLING ERROR
One measure of sampling variability is given by the standard error which indicates the extent to which an estimate might have varied by chance because only a sample of businesses was included. There are about two chances in three that a sample estimate will differ by less than one standard error from the figure that would have been obtained if a census were conducted, and about 19 chances in 20 that the difference will be less than two standard errors.
Sampling variability can also be measured by the relative standard error (RSE) which is obtained by expressing the standard error as a percentage of the estimate to which it refers. The RSE is a useful measure in that it provides an indication of the sampling error in percentage terms, and this avoids the need to refer also to the size of the estimate.
Approximate RSEs for the manufacturing industry experimental estimates have been created using a replicate method. This method uses replicate final estimates created using sub-samples of reported data to estimate the variance of the estimate.
Distribution of RSEs
An indication of the size of RSEs is set out below for both the national ANZSIC class and state/territory ANZSIC subdivision experimental estimates. Individual experimental estimates with RSEs of 10% or more are annotated in the tables in Appendix: Experimental Estimates.
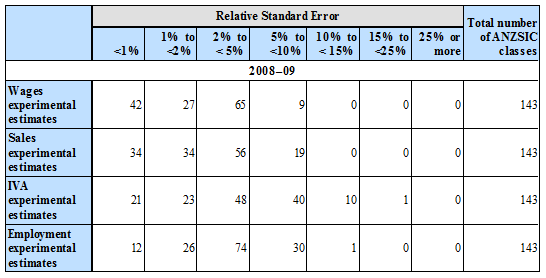
National ANZSIC Class Experimental Estimates
Below is a table which shows the distribution of RSEs for national ANZSIC class experimental estimates for the manufacturing industry for 2008-09. The majority of the national ANZSIC class RSEs were less than 15%, with the exception being IVA (one ANZSIC class with RSE in the 15-25% range). No ANZSIC class had RSEs greater than 25%.
RSEs for National ANZSIC Class Experimental Estimates
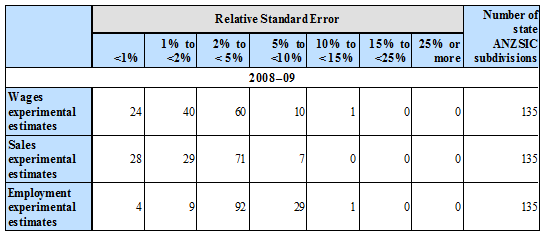
State/Territory ANZSIC Subdivision Experimental Estimates
The table below shows the distribution of RSEs for state/territory ANZSIC subdivision experimental estimates for the manufacturing industry for 2008-09. The majority of the state/territory ANZSIC subdivision RSEs were less than 10%, with the exceptions being wages and salaries and employment, both of which had one state/territory ANZSIC subdivision with RSE in the 10-15% range. No state/territory ANZSIC subdivision had RSEs greater than 15%.
RSEs for State and Territory Subdivision Experimental Estimates
 Print Page
 Print All