CHARACTERISTICS OF ATTENDEES
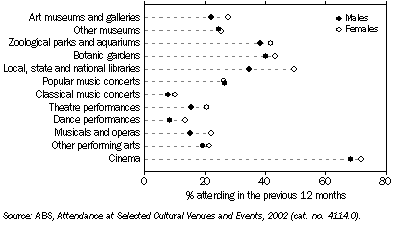
For almost all venues and events, attendance rates for females were higher than for males. The differences were most apparent for Local, state and national libraries (50% of females compared with 35% of males) and Musicals and operas (22% compared with 15%).
1.3 Persons attending selected cultural venues and events, By sex - 2002
Attendance patterns at the cultural venues and events varied considerably for the different age groups.
People aged 18-24 years were those most likely to attend Popular music concerts and the Cinema, while people aged 25-34 years were those most likely to visit Zoological parks and aquariums and Botanic gardens. By comparison, people aged 55-64 years were those most likely to attend Classical music concerts and Musicals and operas.
People aged 65 years and over generally recorded lower attendance rates for all cultural venues and events than younger age groups.
1.4 ATTENDANCE RATES(a), By age - 2002 |
|  |
| Age group (years) | | |
| 18-24 | 25-34 | 35-44 | 45-54 | 55-64 | 65 and over | Total | |
ATTENDANCE RATE (%) | |
| |
| Art museums and galleries | 23.8 | 23.9 | 25.8 | 27.8 | 28.0 | 19.7 | 24.9 | |
| Other museums | 22.3 | 27.0 | 29.1 | 25.3 | 25.7 | 18.3 | 25.0 | |
| Zoological parks and aquariums | 43.2 | 51.9 | 49.1 | 36.7 | 32.8 | 20.1 | 40.0 | |
| Botanic gardens | 42.6 | 45.5 | 43.4 | 41.4 | 42.2 | 33.1 | 41.6 | |
| Local, state and national libraries | 47.2 | 42.0 | 47.4 | 41.9 | 36.9 | 35.7 | 42.1 | |
| Popular music concerts | 43.8 | 33.2 | 25.9 | 24.9 | 20.3 | 10.4 | 26.4 | |
| Classical music concerts | 6.3 | 6.6 | 8.1 | 10.9 | 13.2 | 9.7 | 9.0 | |
| Theatre | 19.8 | 17.7 | 19.4 | 19.9 | 17.6 | 13.0 | 18.0 | |
| Dance performances | 10.5 | 10.3 | 14.0 | 12.1 | 10.7 | 6.9 | 10.9 | |
| Musicals and operas | 16.0 | 17.9 | 17.1 | 21.6 | 23.2 | 16.6 | 18.7 | |
| Other performing arts | 23.3 | 24.0 | 20.9 | 20.6 | 19.5 | 12.9 | 20.4 | |
| Cinema | 92.1 | 81.0 | 76.7 | 69.9 | 56.7 | 38.6 | 69.9 | |
NUMBER ('000) | |
| |
| Total population | 1 904.9 | 2 907.2 | 2 932.8 | 2 644.6 | 1 884.1 | 2 229.7 | 14 503.3 | |
| |
| (a) Number attending in the 12 months before interview as a percentage of the population in the relevant age group. |
| ABS, Attendance at Selected Cultural Venues and Events, 2002 (cat. no. 4114.0). |
 Print Page
 Print All