CHANGE IN COMPOSITION OF DWELLING APPROVALS
INTRODUCTION
This article examines the change in composition of dwelling approvals across Australia from 2006 to 2016. The data presented is from the Australian Bureau of Statistics (ABS) monthly publication Building Approvals, Australia (cat. no. 8731.0). The data used in this article are accurate as at the July 2016 publication and are subject to revision.
Total dwelling approvals comprise of 'houses' and 'other residential' dwellings. Other residential is defined as buildings other than houses which are primarily used for long-term residential purposes. Other residential buildings include: semi-detached, row or terrace houses or townhouses; and flats, units or apartments. Houses are defined as detached buildings used for long term residential purposes, consisting of only one dwelling unit. For further information refer to Functional Classification of Buildings, 1999 (Revision 2011) (cat. no. 1268.0.55.001).
RESULTS
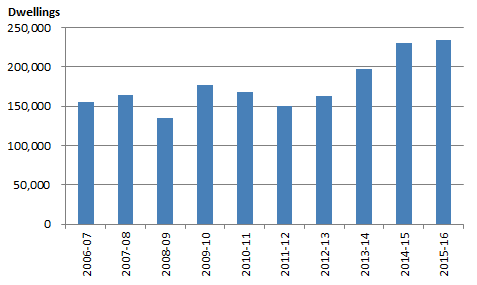
Total Dwelling Approvals, Australia
There has been a large increase in the total number of dwelling approvals over the last 10 years. In original terms, total dwelling approvals have risen from 154,710 in 2006-07 to 234,326 in 2015-16, as depicted in graph 1.
There was a 56% increase in the number of dwellings approved from 2011-12 to 2015-16, compared to an increase of only 9% in the previous 5 years from 2006-07 to 2010-11. The majority of the increase in the total number of dwelling approvals has occurred in the last 5 years.
Graph 1: Total dwellings approved, financial year totals, Australia
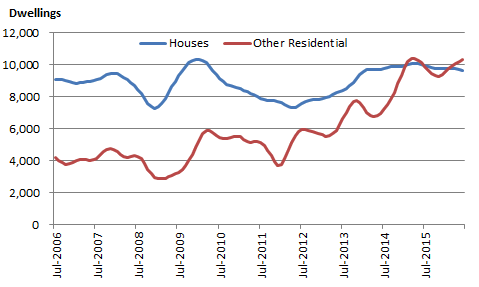
Monthly houses and other residential approvals, Australia
Graph 2 depicts the number of houses and other residential dwellings approved (in trend terms) monthly across Australia from July 2006 to June 2016.
The number of houses approved has increased moderately over the period, rising from 9,051 in the month of July 2006, to 9,647 in June 2016, representing a rise of 7%. Other residential has risen substantially, from 4,162 in the month of July 2006, to 10,284 in June 2016 - an increase of 147%.
Graph 2: Monthly houses and other residential approvals, Australia
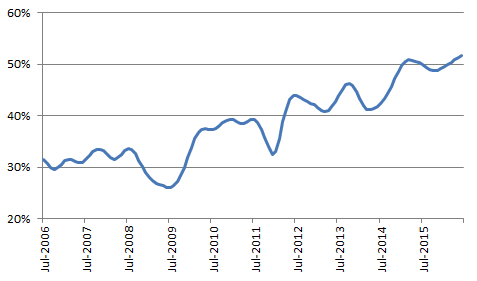
Proportion of other residential across Australia
The relative increase in other residential dwelling approvals has resulted in a change in the composition of total dwelling approvals.
Graph 3 depicts the number of other residential dwellings approved as a proportion of total dwellings approved (using trend data). Other residential dwellings approved have steadily contributed to a greater proportion of total dwellings approved over the period, increasing from 31% of total dwellings approved in July 2006, to 52% in June 2016 (the most recent period). The June 2016 month represents the peak in Other residential dwellings' share of total dwellings approved.
Graph 3: Other residential dwellings as a proportion of total dwellings approved
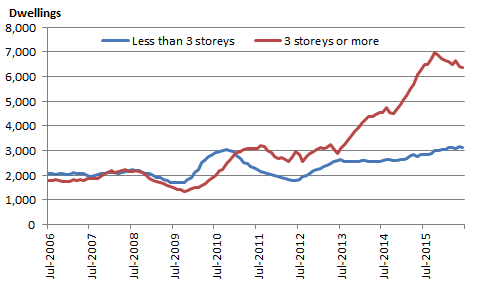
Three storeys or more, Australia
Graph 4 depicts the number of other residential dwellings approved with 'less than three storeys' against the number of other residential dwellings approved with 'three storeys or more', in moving average terms.
Apartment buildings with three storeys or more are used as a proxy for medium-high residential projects and have been the major contributor to the rise of other residential dwellings approved. In moving average terms, the number of dwellings approved in these buildings fell below 1,400 in late 2009, before experiencing a general rise to 3,000 dwellings by early 2011. The series remained relatively flat until mid-2013, when it experienced an unprecedented rise over the next two years, peaking at just under 7,000 dwellings in October 2015 and maintaining a high level thereafter.
Graph 4: Other residential approvals by number of storeys
Change in composition of dwelling approvals by state
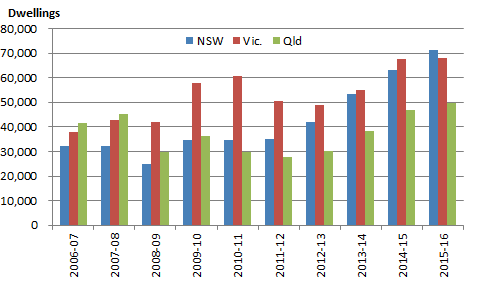
This phenomenon has not been consistent across the states and territories, with the eastern states in particular experiencing a large increase in total dwellings approved. New South Wales, Victoria and Queensland collectively contributed over 80% of the total number of dwellings approved across Australia in the 2015-16 financial year.
The following graph shows the number of total dwellings approved for each eastern state per financial year since 2006-07, in original terms. Significant increases in the annual number of dwellings approved have occurred from the 2011-12 financial year onwards.
Graph 5: Dwelling approvals by state
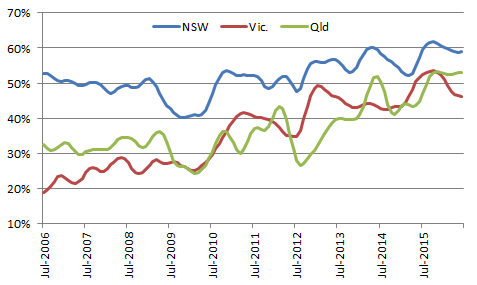
Proportion of Other Residential in NSW, Vic. & Qld
Graph 6 depicts the contribution of other residential dwellings to total dwelling approvals, by state from July 2006 to June 2016, in trend terms.
In the June 2016 month, New South Wales recorded the highest proportion of other residential dwelling approvals (63%), ahead of Queensland (51%) and Victoria (49%). Victoria has seen the largest change in composition of dwelling approvals over the 10 years, with other residential approvals steadily increasing their contribution to the total series from 22% in July 2006, to 49% in June 2016. The share of other residential approvals in Queensland increased from 33% to 51% over the same period, while New South Wales had the smallest increase, from an already high (by national standards) 51% in July 2006 to 63% in June 2016.
Graph 6: Proportion of Other residential by state
CONCLUSION
The rise in other residential dwelling approvals has been a relatively recent phenomenon, highly concentrated in the eastern states and altering the composition of total dwellings approved. Although the total number of other residential approvals peaked in March 2015 (in trend terms), they have continued at a sustained high level through the 2015-16 financial year. The change in the composition of dwelling approvals has resulted in a similar shift in the composition of residential building work done - refer Building Activity, Australia (cat. no. 8752.0).
 Quality Declaration
  Print Page
 Print All