 Quality Declaration
Page tools:
 Print Page Print Page
 Print All Print All
| ||
ANALYSIS BY INDUSTRY FEATURED SERIES The following graphs and commentary refer to income, expenses, operating profit before tax (OPBT), earnings before interest, tax, depreciation and amortisation (EBITDA) and industry value added (IVA) in nominal terms during the relevant financial year(s), and to employment at end June. INDUSTRY RANKING Employment Retail trade remained the highest employer in Total selected industries in 2012-13, as it was in 2007-08. Manufacturing, which in 2007-08 was the second highest employing industry, dropped out of the top five and was sixth in 2012-13, (replaced by Accommodation and food services in the top five). The top five employers in 2012-13 were:
Income and expenses For sales and service income, total income and total expenses, the top four industries did not change between 2007-08 and 2012-13. They were:
ANZSIC DIVISIONS A-J 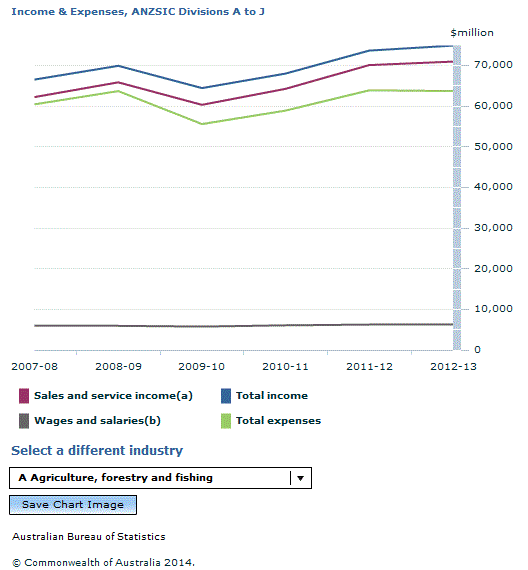 Footnote(s): (a) Includes rent, leasing and hiring income. (b) Includes capitalised wages and salaries; excludes the drawings of working proprietors. Source(s): Australian Industry (cat. no. 8155.0)  Source(s): Australian Industry (cat. no. 8155.0)  Footnote(s): (a) Includes working proprietors and partners of unincorporated businesses. Source(s): Australian Industry (cat. no. 8155.0) Division A Agriculture, forestry and fishing Sales and service income grew by 1.3% between 2011-12 and 2012-13. Total expenses fell by 0.2% and wages and salaries rose by 0.5%. Employment increased by 0.4%. OPBT rose by 13.1%, while EBITDA and IVA rose by 6.3% and 4.4% respectively. Division B Mining Sales and service income declined by 7.5% between 2011-12 and 2012-13. Total expenses and wages and salaries rose by 5.1% and 9.5% respectively, while employment fell by 1.9%. OPBT fell by 34.3% and EBITDA and IVA also declined, by 23.5% and 13.7% respectively. Division C Manufacturing Sales and service income fell by 2.2% between 2011-12 and 2012-13. Wages and salaries declined by 1.4%, total expenses fell by 2.0% and employment fell by 4.3%. OPBT, EBITDA and IVA fell by 24.8%, 10.8% and 4.1% respectively. Division D Electricity, gas, water and waste services Sales and service income rose by 11.7% between 2011-12 and 2012-13 while total income grew at 11.0% over the same period. Wages and salaries and employment rose by 2.2% and 1.9% respectively. Total expenses increased by 10.6%. OPBT also increased by 10.6%. EBITDA and IVA increased by 6.6% and 6.0% respectively. Division E Construction Sales and service income grew by 4.1% between 2011-12 and 2012-13, while total income grew by 2.7%. Wages and salaries grew by 5.3% and employment grew by 0.7%. Total expenses grew by 4.2%. OPBT and EBITDA declined by 13.8% and 2.2% respectively, while IVA grew by 3.1%. Division F Wholesale trade Sales and service income and total income rose by 6.9% and 6.8% respectively between 2011-12 and 2012-13. Wages and salaries grew by 0.6%, while employment fell by 1.5%. Total expenses grew by 6.5%. OPBT, EBITDA and IVA all fell, by 10.0%, 6.5% and 0.9% respectively. Division G Retail trade Sales and service income experienced zero growth and total income fell by 0.1% between 2011-12 and 2012-13. Wages and salaries grew by 1.6% over the same period, and employment also grew (0.7%). Total expenses declined by 0.4%. OPBT, EBITDA and IVA all rose by 8.6%, 3.9% and 2.2% respectively. Division H Accommodation and food services Sales and service income rose by 1.4% between 2011-12 and 2012-13, while total income rose by 1.3%. Wages and salaries rose by 2.3% over the same period, and total expenses rose by 1.1%. Employment increased by 0.3%. OPBT grew by 2.7%, while EBITDA and IVA both increased by 2.3%. Division I Transport, postal and warehousing Sales and service income rose by 3.9% between 2011-12 and 2012-13, while total income grew by 4.1%. Employment grew by 0.3%, while wages and salaries grew by 2.4%. Total expenses rose by 3.4%. OPBT, EBITDA and IVA grew by 10.9%, 5.4% and 3.8% respectively. Division J Information media and telecommunications Sales and service income declined by 3.9% between 2011-12 and 2012-13. Total income declined by 0.8%. Employment fell by 4.8%, but wages and salaries rose by 2.1%. Total expenses fell by 1.8%. OPBT increased by 16.9%. EBITDA and IVA both declined, by 2.3% and 0.8% respectively. ANZSIC DIVISIONS L-S 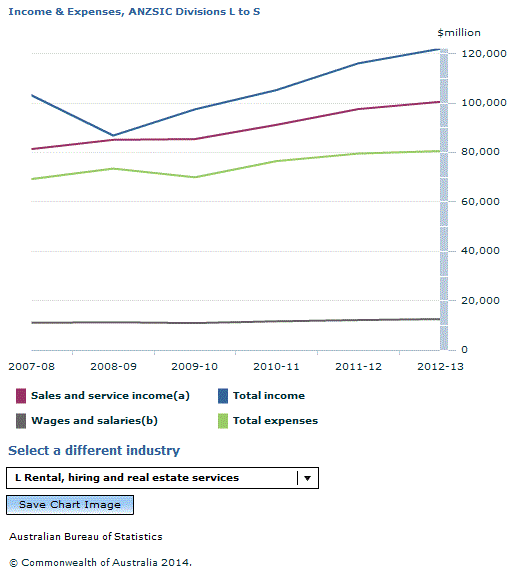 Footnote(s): (a) Includes rent, leasing and hiring income. (b) Includes capitalised wages and salaries; excludes the drawings of working proprietors. Source(s): Australian Industry (cat. no. 8155.0) 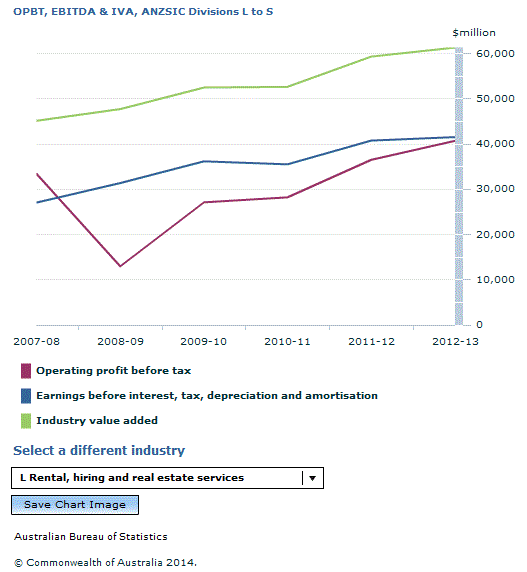 Footnote(s): Estimates for Division O Public administration and safety and Division P Education and training have been excluded. Source(s): Australian Industry (cat. no. 8155.0) 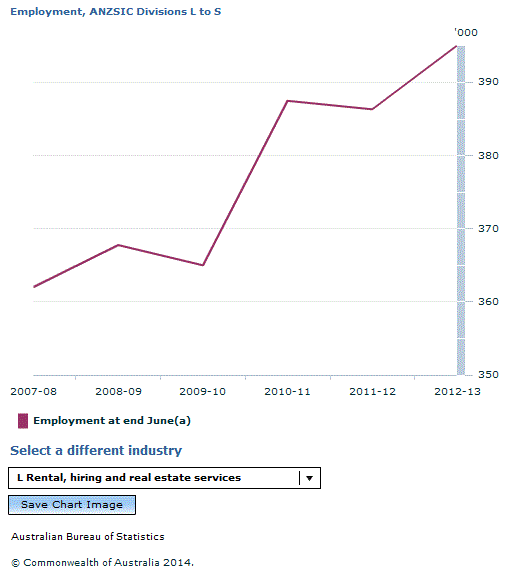 Footnote(s): (a) Includes working proprietors and partners of unincorporated businesses. Source(s): Australian Industry (cat. no. 8155.0) Rental, hiring and real estate services Sales and service income rose by 3% between 2011-12 and 2012-13, while total income rose by 5.1%. Employment rose by 2.3% and wages and salaries increased by 3.5% over the same period. Total expenses rose by 1.3%. OPBT, EBITDA and IVA rose by 11.6%, 2.0% and 3.3% respectively. Professional, scientific and technical services Between 2011-12 and 2012-13, sales and service income rose by 5.6%, while total income fell by 1.8% over the same period. Employment fell by 1.9%, but wages and salaries rose by 3.0% and total expenses increased by 2.1%. OPBT declined by 14.2%, while EBITDA and IVA rose by 11.6% and 4.3% respectively. Administrative and support services Sales and service income rose by 2.1% between 2011-12 and 2012-13, while total income grew by 2.3%. Employment grew by 4.8%, but wages and salaries fell by 0.4%. Total expenses rose by 2.4%. OPBT grew by 1% over the same period, while EBITDA and IVA both fell, by 5.2% and 1.1% respectively. Public administration and safety (private) Between 2011-12 and 2012-13 sales and service income grew by 8.2% and total income rose 8.4%. Employment fell by 0.4%, while wages and salaries rose by 4.0%. Total expenses rose by 10%. OPBT and EBITDA fell by 0.5% and 4.8% respectively, while IVA grew by 0.8%. Education and training (private) Between 2011-12 and 2012-13, sales and service income grew by 8.6%, and total income rose 5.1%. Employment and wages and salaries grew by 2.1% and 8.2% respectively. Total expenses rose by 8.2%. OPBT and EBITDA both declined, by 14% and 5.1% respectively, while IVA grew by 5.9%. Health care and social assistance (private) Sales and service income grew by 2.9% between 2011-12 and 2012-13 and total income rose by 3.1%. Employment fell by 0.5%, while wages and salaries rose by 2.8% over the same period. Total expenses grew by 1.9%. OPBT, EBITDA and IVA all rose, by 8.8%, 10.2% and 4.4% respectively. Arts and recreation services Sales and service income declined by 7.3% between 2011-12 and 2012-13 and employment declined by 4.3%. Total income fell 6%. Wages and salaries remained stable at 0.1% growth, while total expenses declined by 5.2%. OPBT, EBITDA and IVA all fell, by 10.8%, 10.9% and 2.1% respectively. Other services Between 2011-12 and 2012-13, sales and service income grew by 1.3% and total income grew by 1.4%. Employment fell by 6.2% and wages and salaries fell by 1.4%. Total expenses grew by 1.9%. OPBT, EBITDA and IVA all declined, by 2.5%, 5.8% and 2.5% respectively. Document Selection These documents will be presented in a new window.
|
||
