INTRODUCTION
This publication presents statistics on the use of computers and the Internet by farms in Australia. The data were obtained from questions included in the 2002-03 Agricultural Survey conducted by the Australian Bureau of Statistics (ABS). Information obtained was in respect of the year ended 30 June 2003. Some comparisons with data collected in the 2001-2002 Agricultural Survey have been included.
SUMMARY OF FINDINGS
- Of the 132,983 Australian farms with an estimated value of agriculture earnings (EVAO) of $5,000 or more, an estimated 54% (or 71,936 farms) used a computer and 46% (or 60,459 farms) used the Internet as part of their business operations for the year ended 30 June 2003.
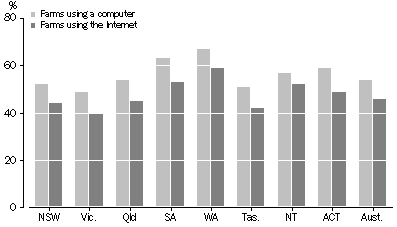
- Western Australia reported the highest proportion of farms using a computer for business operations (67%) and the highest proportion using the Internet for business operations (59%), while Victoria reported the lowest proportions, with 49% and 40% respectively.
FARM COMPUTER AND INTERNET USAGE, by state/territory
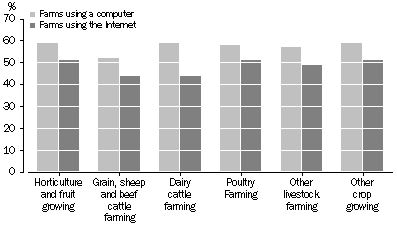
- The horticulture and fruit growing, poultry farming and other crop growing industries reported the highest proportion of farms using the Internet (51%), while the grain, sheep and beef cattle farming and dairy cattle farming industries reported the lowest proportion of farms using the Internet (both 44%).
FARMS USING A COMPUTER OR THE INTERNET, by industry
OTHER INFORMATION
The publication also contains further detailed information on the above points of interest as well other information relating to computer and Internet use, including:
- Use of computers and the Internet, by region
- Use of computers and the Internet, by farm size
 Print Page
 Print All