NEW MOTOR VEHICLE SALES
JANUARY KEY FIGURES, Western Australia |
 | Jan 2010 | Change from previous month | Change from previous year |
| Seasonally Adjusted | no. | % change | % change |
|
| Passenger Vehicles | 4 919 | 13.0 | 7.3 |
| Sports Utility Vehicles | 2 301 | 9.9 | 34.2 |
| Other Vehicles | 2 391 | -12.2 | 13.2 |
| Total Vehicle Sales | 9 611 | 4.8 | 14.3 |
|
| Source: Sales of New Motor Vehicles, Australia (cat. no. 9314.0). |
|
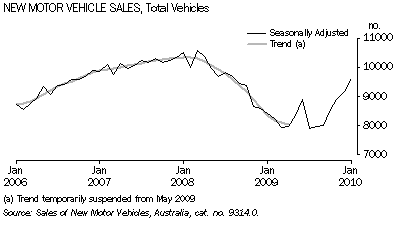
- Sales of new motor vehicles in seasonally adjusted terms increased 4.8% for the month of January 2010 and were 14.3% higher than in the same month of the previous year. This is the seventh consecutive month in which total sales have increased.
- The annualised increase in new motor vehicle sales reflects a very large increase in the sales of sports utility vehicles (up 34%) , including four wheel drive vehicles in the higher price ranges.
- The new motor vehicle sales trend series was suspended from May 2009 and will be reintroduced when more certainty emerges in the underlying behaviour of new car sales.

- For a period of about two years, until the Global Financial Crisis (GFC) took effect in early 2008, monthly motor vehicle sales in Western Australia continued to rise in seasonally adjusted terms. From a peak of about 10,600 in March 2008, sales decreased for the next 12 months, falling below 8,000 by March 2009. Since that time, there has been some volatility in new motor vehicle sales, with global financial uncertainties producing first an increase, then a decrease followed by a more recent increase in sales.
The following links take you to Sales of New Motor Vehicles, Australia, January 2010 (cat. no. 9314.0) and associated Time Series Spreadsheets. Table 2 contains data by state.
 Print Page
 Print All
 Print Page
 Print All