JUNE QTR 2007 CAPITAL CITIES COMPARISON
CAPITAL CITIES COMPARISON
ALL GROUPS
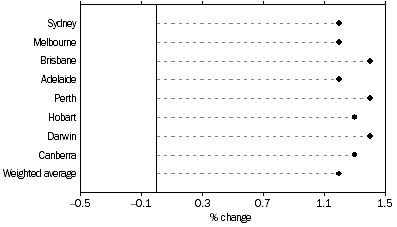
All Groups: Percentage change from previous quarter

At the All groups level, the CPI rose in all capital cities, with little variation between the cities: Brisbane, Perth and Darwin showing rises of 1.4%, Hobart and Canberra at 1.3% and Sydney, Melbourne and Adelaide at 1.2%.
Significant rises in automotive fuel prices were recorded in all cities, with increases in fruit and vegetables, hospital and medical services, rents, furniture and house purchase also being prominent.
Through the year to June quarter 2007, the All groups CPI rose in all capital cities with the increases ranging from 1.7% in Sydney and Adelaide to 3.7% in Darwin. The higher result for Darwin was largely due to a 7.3% rise in Housing, more than double the 3.6% increase for the weighted average of eight capital cities. Perth also recorded a strong rise for Housing (+5.7%). Melbourne and Adelaide showed the lowest rise in Housing, at 2.7% for the year.
CPI, All groups index numbers and percentage changes |
|
 | Index number(a) |  | Percentage change |
 |
|  |
|
 | Jun Qtr 2007 |  | Mar Qtr 2007
to Jun Qtr 2007 | Jun Qtr 2006
to Jun Qtr 2007 |
|
| Sydney | 157.4 |  | 1.2 | 1.7 |
| Melbourne | 155.6 |  | 1.2 | 2.0 |
| Brisbane | 160.2 |  | 1.4 | 2.6 |
| Adelaide | 160.3 |  | 1.2 | 1.7 |
| Perth | 158.0 |  | 1.4 | 3.1 |
| Hobart | 157.4 |  | 1.3 | 2.2 |
| Darwin | 154.7 |  | 1.4 | 3.7 |
| Canberra | 158.0 |  | 1.3 | 2.0 |
| Weighted average of eight capital cities | 157.5 |  | 1.2 | 2.1 |
|
| (a) Base of each index: 1989-90 = 100.0. |
 Print Page
 Print All