Population, participation and productivity: contributions to Australia's economic growth
INTRODUCTION
Economic growth has been described as the increasing ability of an economy to satisfy the wants and needs of its people over time (Parry and Kemp, 2002). As production and incomes in the economy rise, material living standards and other aspects of life are affected. The interaction of a number of factors contributes to economic growth, and these include rising population, increasing inputs such as labour and capital, labour productivity growth and technological progress.
There are many ways to measure economic growth. The simplest way is to compare gross domestic product (GDP) (end note 1) from year to year. A more useful way to measure economic growth is to compare real GDP (end note 2) per person from year to year. This measure relates the real output of the economy to the number of people who produce and consume that output.
This article explores Australia's economic growth over the decade from March 1994 to March 2004. The analysis focuses on five components of economic growth derived from the following identity:
Real GDP / Population (real GDP per person)
= Real GDP / Hours worked (commonly called labour productivity)
x Hours worked / Employed persons (average hours worked per employed person)
x Employed persons / Labour force (employment rate)
x Labour force / Population aged 15 years and over (participation rate)
x Population aged 15 years and over / Population (proportion of the population aged 15 years and over)
Each of these components is examined in more detail in the following sections. For definitions of these terms, see the endnotes.
ECONOMIC GROWTH IN AUSTRALIA
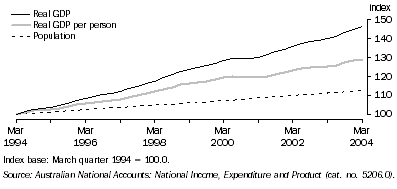
Following the downturn of the early 1990s, Australia experienced more than a decade of sturdy economic growth. Between the March quarter 1994 and the March quarter 2004, the average rate of growth in real GDP was 3.9% a year. Over the same period, the Australian population grew at an average rate of 1.2% a year, leading to a growth in real GDP per person of 2.6% a year.
1. Real Gross Domestic Product Per Person
LABOUR PRODUCTIVITY
Labour productivity is the relationship between hours worked (end note 3) and output. Increases in labour productivity can reflect technological advances, increased education and training, increased competition, improvements in production methods within firms, and the shift of labour and capital towards firms or industries that are more efficient. Productivity growth is a key driver of real economic growth in the long term.
2. Real Gross Domestic Product per hour worked
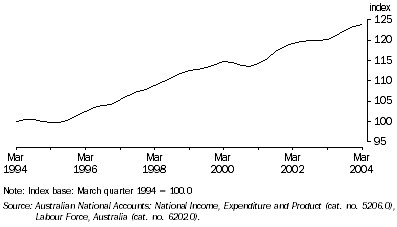
Between March 1994 and March 2004, labour productivity (measured by real GDP per hour worked) rose by more than 24% - an annual average growth of 2.1%.
AVERAGE HOURS WORKED
The ratio between total hours worked and the number of employed people is known as average hours worked per employed person. Increases in average hours worked per employed person may lead to increases in total production, which in turn may contribute to economic growth, although this is not necessarily the case. Growth or decline in average hours worked is largely influenced by the proportion of part-time workers.
3. Average hours worked (a)
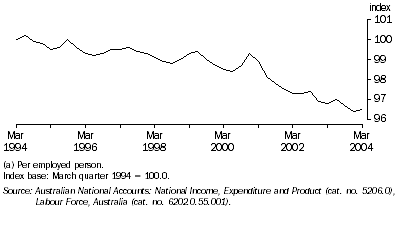
Between March 1994 and March 2004, the average hours worked by employed people fell by 3% - an annual average fall of 0.4%.
The decline in average hours worked was mainly driven by large increases in the number of part-time workers. Between March 1994 and March 2004 the number of part-time workers rose by 44.9%, compared to an increase of 15.8% in the number of full-time workers.
EMPLOYMENT RATE
The proportion of employed people in the labour force is referred to as the employment rate. An increase in the employment rate (or a decrease in the unemployment rate) can contribute to economic growth by increasing total production, income and expenditure. A rise in the employment rate generally reflects more buoyant labour market conditions.
4. Employment rate
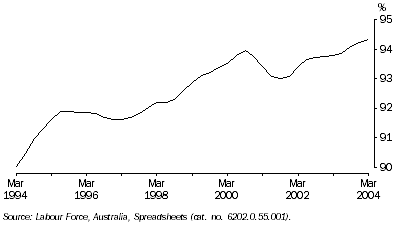
Between March 1994 and March 2004 the employment rate rose from 90.0% to 94.3%, an increase of 4.3 percentage points, making a positive contribution to economic growth. Over the ten year period the employment rate averaged an annual growth of 0.5%.
Strong growth in the employment rate was evident for both men and women - up by 4.9 and 3.5 percentage points respectively.
PARTICIPATION RATE
The participation rate is the labour force expressed as a percentage of the civilian population aged 15 years and over. It represents the proportion of the population who are either in a job or actively seeking work. An increase in the participation rate reflects a greater proportion of the working age population available to work, which can contribute to economic growth by increasing the effective labour supply.
5. Participation rate
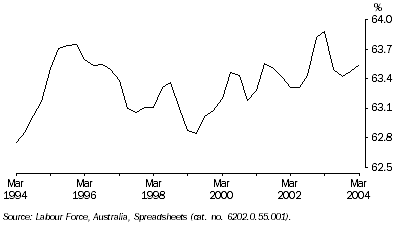
Between March 1994 and March 2004, the labour force participation rate rose from 62.8% to 63.5% - an annual average growth of 0.1%.
Over the ten year period, participation rates for men and women moved in opposite directions. The participation rate for men fell over the period - down 1.7 percentage points to 71.8%. Conversely, the participation rate for women rose 3.3 percentage points to 55.6%. Greater female participation in the labour force has been cited as the major driving force behind the increase in participation rates over the last 25 years (Productivity Commission, 2004).
PROPORTION OF THE POPULATION AGED 15 YEARS AND OVER
The population aged 15 years and over represents the maximum potential size of the labour force within this age range. An increase in the proportion of the population within this age range may indicate that relatively more of the population is available to work, and can contribute to economic growth by increasing the size of the labour force, which in turn can increase total production and lead to higher per person incomes.
An increase in the proportion of the population aged 15 years and over may also reflect the ageing of the population. This trend, which is evident in Australia, may constrain future economic growth as a greater number of workers retire, reducing growth within the labour force.
6. Population aged 15 years and over as a proportion of total population
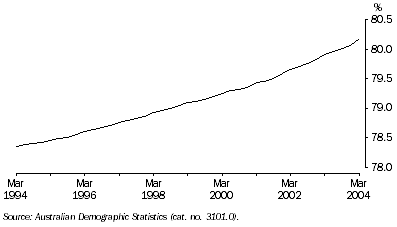
Over the ten years from March 1994 to March 2004, the proportion of the population aged 15 years and over increased from 78.4% to 80.2% - an annual average growth of 0.2%.
CONCLUSION
The average annual rate of economic growth (measured by real GDP per person) is approximately equal to the sum of the average annual rate of increase in the five components. Analysis of these five components between March 1994 and March 2004 reveals that improvements in labour productivity made the largest contribution to the increase in Australia's real GDP per person (contributing 2.1 percentage points to the 2.6% rise). Other components contributing to Australia's economic growth were increases in the employment rate and the proportion of the population aged 15 years and over (contributing 0.5 and 0.2 percentage points respectively). The slight increase in the participation rate had a negligible effect on economic growth (contributing 0.1 percentage points), while the only component not to contribute to Australia's economic growth over the decade was average hours worked (which fell by an average of 0.4% a year).
7. Contribution of components to economic growth(a) - March 1994 to March 2004 |
|  |
 | Average annual growth rate |  |
| Component | % |  |
|  |
| Real GDP / Hours worked (labour productivity) | 2.1 |  |
| Hours worked / Employed persons (average hours worked) | -0.4 |  |
| Employed persons / Labour force (employment rate) | 0.5 |  |
| Labour force / Population aged 15 and over (participation rate) | 0.1 |  |
| Population aged 15 and over / Population | 0.2 |  |
| Real GDP / Population | 2.6 |  |
|  |
| (a) Average annual growth rates. |
Over the coming decades the ageing of Australia's population and a projected slowing in the rate of population growth are expected to affect the nation's economic growth. The components of the above decomposition most likely to be affected by the population changes are average hours worked and the participation rate, as people get older and move into part-time work or out of the labour force.
FURTHER INFORMATION
For further information, please contact the Director, Capital, Production and Deflators on 02 6252 6713. For email enquiries, please contact Client Services on client.services@abs.gov.au.
REFERENCES
Parry, G. and Kemp, S. 2002, Exploring Macroeconomics, Tactic Publications, Perth.
Productivity Commission 2004, Economic Implications for an Ageing Australia, Draft Research Report, Productivity Commission, Canberra.
ENDNOTES
1. Gross domestic product (GDP) is the total market value of goods and services produced in Australia within a given period, after deducting the cost of goods and services used up in the process of production, but before deducting allowances for the consumption of fixed capital. See Australian National Accounts: National Income, Expenditure and Product (cat. no. 5206.0) for more information.<Back
2. Real GDP is GDP at market prices, adjusted for price changes. The ABS measures real GDP using chain volume estimates. Chain volume estimates of GDP are derived by revaluing current price, income-based estimates of GDP, using deflators which are calculated from the expenditure components of the series concerned. < Back
3. Hours worked are derived by multiplying average hours worked published in Labour Force, Australia, Detailed - Electronic Delivery (cat. no. 6291.0.55.001) by employment data. Estimates of employment are derived as the sum of civilian employment and defence force personnel. See Australian System of National Accounts: Concepts, Sources and Methods (cat. no. 5216.0) for more information.< Back
 Print Page
 Print All