Full-time and part-time participation in the Australian labour force: a cohort analysis
INTRODUCTION
The increase in the proportion of people participating part-time in the labour force over the past 25 years has attracted a great deal of interest from researchers and policy analysts. In 1978, 15% of the labour force was participating part-time compared to 29% in 2004. Patterns of part-time and full-time participation are related to stages of the lifecycle. For example, the decision to work part-time or full-time will tend to be related to participation in education, family commitments or the work to retirement transition. These types of events are more commonly associated with certain age groups.
Different cohorts may also have different attitudes, expectations and experiences that will affect their part-time and full-time participation rates regardless of age. In this article a cohort is defined as a group of people who were born during the same calendar year.
This article examines the effects that age, year and cohort have on part-time and full-time participation. The analysis tracks the part-time and full-time participation rates of successive birth cohorts over time, using data from the Labour Force Survey between 1981 and 2004. A regression-based decomposition analysis is used in this article to separate full-time and part-time labour force participation into three distinct components - the cohort effect, the age effect and the year effect. This is an extension of work published by the ABS in the July 2003 edition of Australian Labour Market Statistics (cat. no. 6105.0) titled 'Unemployment and Participation in Australia: a Cohort Analysis'.
The article firstly examines the concepts, data and methodology used in the analysis. This is followed by a discussion of the results.
COHORT ANALYSIS
The analysis is restricted to cohorts aged between 18 and 60 in each year. In each year, a new cohort of people turns 18 and enter the scope of the analysis, and another cohort turns 60 and leave the scope of the analysis. Since the analysis starts at 1981, and cohorts appear in the analysis for a minimum of nine years (to allow enough observations for the analysis), the oldest cohort is the 1929 cohort. This cohort appears in the analysis from 1981 (when they turn 52) until 1989 (when they turn 60). The last new cohort used in the analysis is the cohort born in 1978. This cohort appears in the analysis in 1996 and disappears after 2004, again giving us nine observations for analysis. This is illustrated in Figure 1.
1. Example of cohorts entering and exiting the model
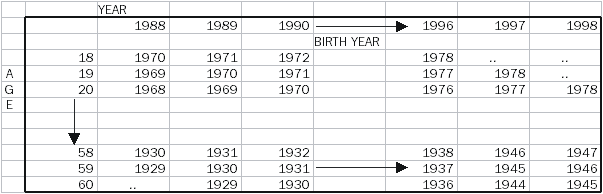
A minimum of nine observations is set as it allows enough observations for the model to safely distinguish a cohort effect from the other two effects. The use of nine observations was settled upon through the analysis of different models.
The analysis (a regression-based decomposition analysis) separates the effects of three distinct components that could influence full-time and part-time labour force participation - the age effect, the cohort effect and the year effect.
Age effect
This is the effect that a person's age had on their chances of participating in the labour force, either part-time or full-time (whatever the year or their cohort). The age effect captures movements over the lifecycle. Younger people experience higher levels of part-time participation than those in the prime working age groups. Their part-time participation rates decline as people leave education and gain work experience. Full-time participation rates are expected to move in the opposite direction.
Cohort effect
This is the effect that the cohort into which a person was born had on their chances of participating in the labour force either part-time or full-time (whatever the year and whatever their age). The cohort effect captures movements in part-time and full-time participation that are exclusive to particular cohorts over the whole period. For example, women born in the 1950s have had different labour market experiences to those born in the 1970s.
Year effect
This is the effect that the year had on any individual's chances of participating in the labour force part-time or full-time (whatever their age or cohort). The year effect captures movements or one off 'shocks' that affect all cohorts. For example, in a year of low economic growth the employment levels of all cohorts may be affected. The year effect cannot be considered in isolation. Instead, the year effect can be considered a residual after the cohort and the age effects have been accounted for.
Method
In year Y, the probability that an individual of age A and belonging to cohort C, will participate in the part-time labour force (or in the full-time labour force) can be decomposed into three effects:
year effect (for year Y) + age effect (for age A) + cohort effect (for cohort C)
The age effect represents the difference between the rate for a particular reference age (the reference age used in this article is 18 years) (end note 1) and the rate for other ages. The cohort effect represents the difference between the cohort reference group (people born in 1954) and the rate for other cohorts. The year effect represents the difference between the rate for a particular year and the average rate for the period.
For more details about the method of analysis please refer to Deaton, A. (1997).
Part-time and full-time participation rates
The analysis presented in this article is based on part-time and full-time participation rates for each cohort in each year. The participation rates for each group are calculated as:
Part-time (end note 2) participation rate = (number of people in part-time employment + number of unemployed people looking for part-time employment) / total number of people
and
Full-time (end note 3) participation rate = (number of people in full-time employment + number of unemployed people looking for full-time employment) / total number of people
Together the part-time and full-time participation rates sum to the labour force participation rate.
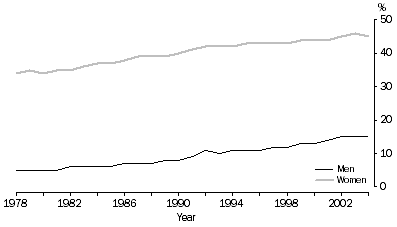
In 1978, 5% of men and 34% of women in the labour force were part-time. By 2004, this had grown steadily to 15% and 45% of the labour force for men and women respectively. This is illustrated in Graph 2.
2. Part-time participation rate: Trend estimates
THE EFFECT OF AGE
Age has the strongest of all of the three effects on both full-time and part-time participation. Graphs 3 and 4 show that the relationship between age and full-time and part-time participation is very different for men and women. There is a strong life-cycle pattern for both sexes.
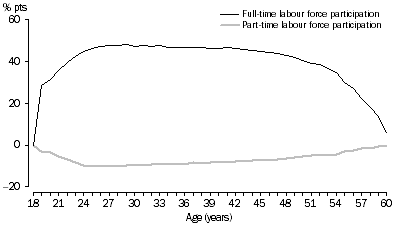
Men
Graph 3 shows the relationship between age and full-time and part-time participation for men. The coefficients of the age effect are expressed in percentage point changes from the average participation of 18 year olds during the period. So 19 year olds have a full-time participation rate which is 29 percentage points higher than the rate for 18 year olds.
Full-time participation rises quickly for men during their twenties, peaking at age 29. There is then a slow and steady decline in full-time participation until men reach their 50s, when the decline becomes far more rapid.
To some extent the part-time age effect moves in the opposite direction to the full-time age effect. Part-time participation is lowest at age 28. There is a very gradual increase in part-time participation with age. As men get older, some may withdraw from full-time work and maintain contact with the labour force through part-time work.
3. Age effect, Men
Women
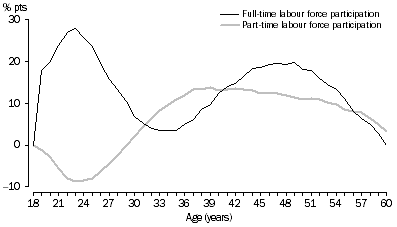
Graph 4 shows that the relationship between age and both full-time and part-time participation for women is very different to that of men. Female full-time participation falls quite rapidly with age as women enter their peak child-bearing years (age 25-34) (end note 4). There appears to be some relationship between declining full-time and rising part-time participation rates over these years, reflecting the fact that many women combine child-raising with part-time employment.
Part-time participation remains relatively high and fairly steady from around age 36 to 53, compared with women aged 18. Full-time participation increases from age 36 to age 50. These participation patterns are consistent with increasing numbers of women returning to the labour force or working longer hours as their children get older. Full-time participation declines quite quickly after age 50. Part-time participation also declines at a faster rate after age 53.
4. Age effect, Women
THE EFFECT OF THE COHORT
Men
The coefficients of the cohort effect are expressed as percentage point changes from the average participation of the 1954 cohort (the middle cohort) during the period. For example, the 1929 cohort has a part-time participation rate which is five percentage points lower than the 1954 cohort.
Graph 5 clearly shows that after controlling for age and year effects, earlier cohorts of men were more likely to participate full-time than later cohorts. In fact, men born in 1929 had full-time participation rates which were 8.5 percentage points higher on average (between 1981 and 2004) than men born in 1978.
Later cohorts of men are more likely to participate part-time than their earlier counterparts. Men born in 1929 had part-time participation rates which were 18.3 percentage points lower on average than men born in 1978.
5. Cohort effect, Men
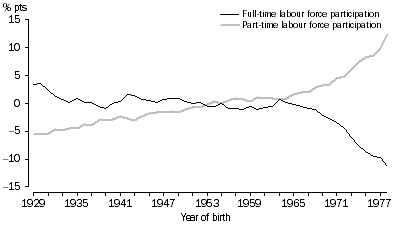
From around the 1965 cohort there appears to be a more rapid divergence between the full-time and part-time cohort effects with part-time labour force participation increasing and full-time participation decreasing. This may indicate increased preferences and/or opportunities for part-time employment among the later cohorts.
There is not a clear understanding of why these changes are occurring to men's participation. Possible influences include: changing roles of men in families; structural and workplace changes in the economy; the trend towards students working part-time while studying; and the overall increase in participation in further education during the past twenty years (end note 5). These factors are known to have affected women's part-time participation rates as well.
Women
Graph 6 shows that later cohorts of women are more likely to participate (both full-time and part-time) than the earlier cohorts. Full-time and part-time participation generally increased for successive cohorts up until the 1959 cohort. After this cohort there was a strong increase in full-time participation for each successive cohort, until the 1970 cohort. From this cohort on there is a fall in full-time participation.
Part-time participation remained relatively unchanged for each cohort born between 1960 and 1970. From the cohorts born in the early 1970s part-time participation increased. A similar trend is evident in the male cohort effect.
6. Cohort effect, Women
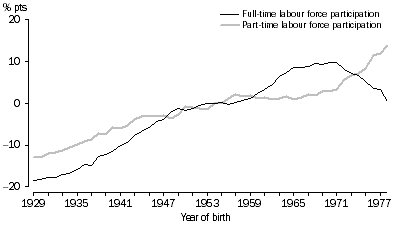
This pattern in the cohort effect is likely to be the result of the interaction of a number of factors. For example, increased access to education (and women wanting to gain a return on their investment in their education) and changing social attitudes towards women, such as a greater general acceptance of women in work, are likely to have contributed to the increase in the participation of women in the labour force over the period. In addition, the labour market has changed with the increased availability of part-time jobs and the opportunity to combine work and study.
THE YEAR EFFECT
The year effects for men for both part-time and full-time participation are not statistically significant. That is, on average over the period, the year does not significantly affect male participation in either full-time or part-time participation, although the year can certainly affect employment among men. As a result the year effect coefficients are not presented in this article.
The year effect for women participating full-time is also not statistically significant. The part-time year effect is statistically significant, but when compared to the other two effects the year effect is quite small. The largest effect is 1.5 percentage points for part-time participation in 1990. Women’s part-time participation appears to be more strongly influenced by the economic cycle than men’s participation or women's full-time participation. This may reflect a propensity among these women to leave the labour force rather than remain unemployed when jobs become harder to find.
SUMMARY
There is a strong lifecycle pattern to part-time and full-time participation rates for both men and women, although these patterns show clear gender differences. The effect of the lifecycle on women's full-time and part-time participation reflects family formation and child-bearing. Part-time participation rates are high for women of peak child-bearing ages who are combining work with family commitments, while full-time participation rates are particularly low at these ages.
People from different cohorts have very different patterns of part-time and full-time participation. Later cohorts of women tend to have higher rates of both part-time and full-time participation than earlier cohorts did, regardless of age. Men from later cohorts have higher part-time participation rates than men from earlier cohorts did. However, full-time participation rates for later male cohorts have fallen by more than part-time participation rates have risen.
END NOTES
1. These reference groups have been chosen to allow easy interpretation of the results. However, any group could be used as the reference group without changing the outcome of the analysis. For example, if 18 is the reference age and participation at age 19 is 15% higher, and at age 20 is 20% higher, then if we used age 19 as the reference, age 18 would have participation 15% lower and age 20 would have participation 5% higher. < Back
2. People who usually work less than 35 hours a week (in all jobs). < Back
3. People who usually work 35 hours or more a week (in all jobs). < Back
4. Until 2000, age specific fertility rates were consistently highest for the 25-29 year age group. After this point women aged 30-34 years experienced the highest fertility of all age groups (ABS 2001). < Back
5. Australian Bureau of Statistics (ABS) (2005), 'Labour Force Participation in Australia', Australian Labour Market Statistics, January 2005, pp 10-18 (cat. no. 6105.0), ABS, Canberra and 'Changes across Australian generations', Australian Social Trends 2002 edition, pp 46-51 (cat. no. 4102.0), ABS, Canberra. < Back
REFERENCES
Australian Bureau of Statistics (ABS) (2001), Births, Australia (cat. no. 3301.0), ABS, Canberra.
Australian Bureau of Statistics (ABS) (2005), 'Labour Force Participation in Australia', Australian Labour Market Statistics, January 2005, pp 10-18 (cat. no. 6105.0), ABS, Canberra.
Australian Bureau of Statistics (ABS) (2003), 'Unemployment and Participation rates in Australia: A Cohort Analysis', Australian Labour Market Statistics July 2003, pp 16-21 (cat. no. 6105.0), ABS, Canberra.
Australian Bureau of Statistics (ABS) (2002),'Changes across Australian generations', Australian Social Trends 2002 edition, pp 46-51 (cat. no. 4102.0), ABS, Canberra.
Deaton, A., (1997), 'The analysis of household surveys : A microeconomic development policy', Johns Hopkins University Press, Baltimore.
Ravindirian, R., Rawnsley, T. and Jose, A. 2002, ‘A cohort analysis of unemployment rates for Australia’, Analytical Services Branch, Australian Bureau of Statistics, paper presented at the 31st Annual Conference of Economists, September 2002, Adelaide.
Weiss, Y., Lillard, L., (1978), 'Experience, vintage, and time effects in the growth of American scientists, 1960-1970', Journal of Political Economy, no.86, pp 427-447.
 Print Page
 Print All