SEPTEMBER KEY FIGURES
 | Trend estimates
| Seasonally adjusted estimates
| |
| Sep 2004 | Aug 2004 to Sep 2004 | Sep 2004 | Aug 2004 to Sep 2004 | |
| |
| Value of dwelling commitments(a) | $m | % change | $m | % change | |
| Total dwellings | 15,565 | 0.1 | 15,793 | 1.8 | |
| Owner occupied housing | 10,235 | 0.5 | 10,267 | 0.6 | |
| Investment housing - fixed loans(b) | 5,329 | -0.7 | 5,525 | 4.1 | |
| Number of dwelling commitments(a) | no. | % change | no. | % change | |
| Owner occupied housing | 49,262 | 0.1 | 49,338 | -0.6 | |
| Construction of dwellings | 4,610 | -1.2 | 4,621 | -2.5 | |
| Purchase of new dwellings | 1,896 | 1.3 | 1,869 | -2.8 | |
| Purchase of established dwellings | 42,756 | 0.1 | 42,848 | -0.3 | |
| |
| (a) Includes refinancing. |
| (b) Excludes revolving credit. |
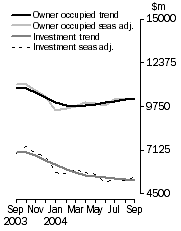
Housing finance, Value of dwellings
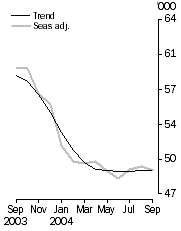
| Owner occupied housing finance, Number of dwellings
|
SEPTEMBER KEY POINTS
TREND ESTIMATES
- Total value of dwelling finance commitments increased by 0.1% in September 2004, the fifth consecutive month of slight increases. Owner occupied housing rose by 0.5%, the sixth consecutive month of small increases. Investment housing decreased in September 2004 (down 0.7%) for the twelfth consecutive month.
- The number of housing finance commitments for owner occupation increased by 0.1% in September 2004, while the number excluding refinancing remained virtually unchanged.
SEASONALLY ADJUSTED ESTIMATES
- Total value of housing finance commitments rose by 1.8% in September 2004, following a fall of 0.7% in August. This increase was due to the increases in investment housing commitments (up 4.1%) and owner occupied housing commitments (up 0.6%).
- The number of housing finance commitments for owner occupied housing decreased by 0.6% in September 2004, following an increase of 0.4% in August 2004. The number excluding refinancing decreased by 1.4%.
ORIGINAL ESTIMATES
- The percentage of first home buyer commitments increased for the sixth consecutive month after the record low in March 2004, increasing to 16.2% in September 2004.
NOTES
CHANGES IN THIS ISSUE
There are no significant changes in this issue.
INQUIRIES
For further information about these and related statistics, contact the National Information and Referral Service on 1300 135 070 or Darren Page on Canberra (02) 6252 6731.
SUMMARY COMMENTARY
SUMMARY OF FINDINGS
DWELLINGS FINANCED
Value of Dwellings Financed
The total value of dwelling commitments excluding alterations and additions (seasonally adjusted) increased by 1.8% in September 2004, following a fall of 0.7% in August. The total housing finance trend increased by 0.1% in September 2004, the fifth month of slight increases following seven consecutive monthly decreases.
The total value of owner occupied commitments (seasonally adjusted) increased by 0.6% in September 2004, following a 0.1% increase in August. The small increase in the value of commitments compared to the decline in number of commitments reflects growth in the average loan size in September. An increase in the refinancing of established dwellings (up 3.7%) was offset partially by decreases in purchase of new dwellings (down 1.5%), purchase of established dwellings excluding refinancing (down 0.5%) and construction of dwellings (down 0.2%). The trend series in the value of owner occupied commitments rose by 0.5% in September.
The seasonally adjusted series for value of investment housing commitments (including finance for construction and finance for rent or resale) increased by 4.1% in September 2004, following an fall of 2.2% in August. The increase this month was primarily due to rises in finance for the purchase of dwellings for rent or resale by individuals (up 5.7%) and construction of dwellings for rent or resale (up 4.5%). Partially offsetting these increases was a decrease in purchase of dwellings for rent or resale by others (down 9.5%). The trend series in total value of investment commitments fell by 0.7%.
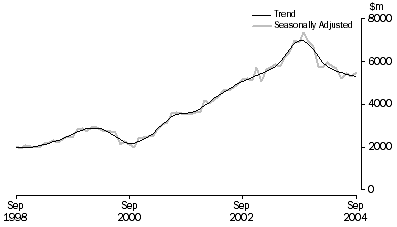
INVESTMENT HOUSING - TOTAL
Number of Owner Occupied Dwellings Financed
The number of owner occupied dwelling commitments (seasonally adjusted) decreased by 0.6% in September 2004, following a rise of 0.4% in August. The decrease was due to decreases in the purchase of established dwellings excluding refinancing (324, -1.1%), construction of dwellings (down 119, -2.5%), purchase of new dwellings (down 53, -2.8%). Partially offsetting these decreases was an increase in refinancing of established dwellings (up 191, 1.3%).
The total owner occupied housing finance trend rose by 0.1% in September 2004, after remaining flat in August and July following nine monthly decreases.
Decreases were recorded in seasonally adjusted terms for Queensland (down 364, -3.6%) and South Australia (down 44, -1.0%). These decreases were partially offset by rises in New South Wales (up 227, 1.5%), Western Australia (up 81, 1.1%), Victoria (up 54, 0.5%), Tasmania (up 44, 4.3%), Australian Capital Territory (up 26, 4.7%) and Northern Territory (up 23, 4.4%). The trend increased in Victoria, South Australia, Western Australia and Northern Territory, and decreased in other states and territories.
In original terms, first home buyer commitments as a percentage of total owner occupied housing commitments rose to 16.2% in September 2004, the sixth consecutive monthly increase since the record low of 12.8% in March 2004.
Number of Owner Occupied Dwellings Financed Excluding Refinancing
The number of owner occupied dwellings financed excluding refinancing (seasonally adjusted) decreased by 1.4% in September 2004, after a 1.2% increase in August. The trend was virtually unchanged in September 2004, remaining relatively steady since April 2004 after eight consecutive monthly declines.
PURPOSE OF FINANCE (OWNER OCCUPATION)
Construction of dwellings
The seasonally adjusted number of construction commitments for owner occupation fell by 2.5% in September 2004, after an increase of 2.3% in August. The trend series fell 1.2% in September 2004, continuing its decline since September 2003 but at a decelerating rate for the third successive month.
Purchase of new dwellings
The number of finance commitments for the purchase of new dwellings for owner occupation (seasonally adjusted) fell by 2.8% in September 2004, following increases in the previous three months. The trend series rose 1.3% in September 2004.
Purchase of established dwellings
The seasonally adjusted established dwelling for owner occupation series decreased by 0.3% in September 2004, after a 0.1% increase in August. The trend rose by 0.1% in September 2004, the fourth month of slight increases following eight consecutive monthly decreases.
Refinancing
The number of refinancing commitments for owner occupied housing (seasonally adjusted) rose by 1.3% in September 2004, after a fall of 1.4% in August. The trend series increased by 0.2% in September, the second slight increase following nine consecutive monthly decreases.
NUMBER OF OWNER OCCUPIED DWELLINGS FINANCED BY TYPE OF LENDER
Banks
The number of owner occupied dwellings financed by banks (seasonally adjusted) decreased by 0.7% in September 2004, after remaining virtually unchanged in August. The trend series increased by 0.1% in September.
Non-banks
The number of non-bank commitments for owner occupied housing (seasonally adjusted) decreased by 0.3% in September 2004, after increasing by 1.8% in August. Permanent building societies were down 6.5% while wholesale lenders were up 0.5%. The non-bank trend series increased by 0.1% in September 2004, the first increase since September 2003.
HOUSING LOAN OUTSTANDINGS
At the end of September 2004, housing loans outstanding of authorised deposit-taking institutions was $476,663m, down $792m (-0.2%) from August's closing balance. Owner occupied housing loans decreased by $1,018m (-0.3%) to close at $315,522m, while investment housing loans outstanding increased by $226m (0.1%) to reach a closing balance of $161,141m.
Bank loans decreased by $1,080m (-0.2%) during September to a closing stock of $448,278m. Owner occupied housing loans of banks decreased by $1,154m (-0.4%) to $292,880m, while investment housing loans increased $74m to $155,398m. The decreases in owner occupied balances are the results of securitisation activity during September.
 Print Page
 Print All