November Key Figures
Balance of Payments (BPM5) - Monthly (Current Price) |
|  |
| September 2003 | October 2003 | November 2003 | Oct 03 to Nov 03 | |
| $m | $m | $m | % change | |
Trend | |
| |
| Balance on goods & services | -2,021 | -1,913 | -1,850 | 3 | |
| Credits (exports of goods & services) | 11,502 | 11,587 | 11,643 | - | |
| Debits (imports of goods & services) | 13,523 | 13,500 | 13,493 | - | |
Seasonally Adjusted | |
| |
| Balance on goods & services | -2,282 | -1,702 | -1,727 | -1 | |
| Credits (exports of goods & services) | 11,498 | 11,720 | 11,651 | -1 | |
| Debits (imports of goods & services) | 13,780 | 13,422 | 13,378 | - | |
| |
| - nil or rounded to zero (including null cells) |
| | | | | |
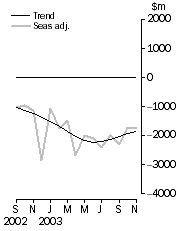
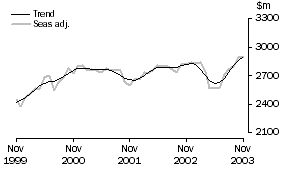
Balance on goods and services
| |
November Key Points
TREND ESTIMATES
- The provisional trend estimate of the balance on goods and services was a deficit of $1,850m in November 2003, a decrease of $63m (3%) on the deficit in October.
- Goods and services credits rose $56m to $11,643m. Goods and services debits fell $7m to $13,493m.
SEASONALLY ADJUSTED ESTIMATES
- In seasonally adjusted terms, the balance on goods and services was a deficit of $1,727m in November, an increase of $25m (1%) on the deficit in October.
- Goods and services credits fell $69m (1%) to $11,651m, with services credits down $76m (3%), and goods credits up $7m. Rural goods fell $95m (5%), while non-rural and other goods rose $102m (1%).
- Goods and services debits fell $44m to $13,378m, with goods debits down $43m and services debits down $1m. Consumption goods fell $56m (2%), intermediate and other goods fell $190m (4%), while capital goods rose $203m (8%).
ORIGINAL ESTIMATES
- In original terms, the November balance on goods and services was a deficit of $1,580m, a decrease of $1,632m (51%) on the deficit in October. The decreased deficit was the result of a $1,988m (13%) fall in imports of goods and services, partially offset by a $356m (3%) fall in exports of goods and services.
Notes
REVISIONS
In original terms, revisions since the previous issue have:
- increased the deficit on goods and services for the four months to October by $202m
- decreased the deficit on goods and services for 2002-03 by $127m.
The revisions are the result of incorporating the latest available data relating to merchandise trade and the quarterly Survey of International Trade in Services.
FEATURE ARTICLES
A feature article on Australia's Importers, 2002-03 has been released on the ABS web site concurrently with the release of this publication. The article is the fourth in a series analysing the characteristics and international trading activities of Australia's exporters and importers. The analysis has been facilitated by the ability to identify exporters and importers using the Australian Business Number (ABN).
The number of Australian importers of goods and services in 2002-03 increased by 5.7% to 58,523 from the estimate of 55,355 importers in 2001-02. This estimate is consistent with the 8.1% increase in the total value of imports of goods and services from $154.6b in 2001-02 to $167.1b in 2002-03.
To access these articles on the web site select: Themes then International Trade then Topics of Interest.
CAUTIONARY NOTE
The tables in this publication are presented on two bases. Tables 1-6 contain estimates of Australia's international trade in goods and services which have been adjusted for coverage, valuation and timing to a balance of payments basis. Tables 7-10 contain estimates of merchandise exports and imports based on Australian Customs Service records. Paragraph 5 of the Explanatory Notes provides an explanation of the difference between these bases.
Inquiries
For further information about these and related statistics, contact the National Information and Referral Service on 1300 135 070 or Artur Andrysiak on Canberra 02 6252 6792.
Analysis and comments
BALANCE ON GOODS AND SERVICES
The trend estimate of the balance on goods and services in November 2003 was a deficit of $1,850m, a decrease of $63m (3%) on the deficit in October.
In seasonally adjusted terms, the balance on goods and services in November 2003 was a deficit of $1,727m, an increase of $25m (1%) on the deficit in October.
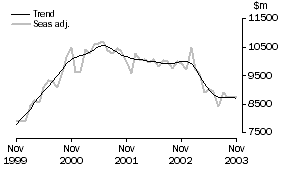
EXPORTS OF GOODS AND SERVICES
The trend estimate of goods and services credits rose $56m in November to $11,643m.
In seasonally adjusted terms, goods and services credits fell $69m (1%) in November to $11,651m. Rural goods fell $95m (5%), services credits fell $76m (3%), while non-rural and other goods rose $102m (1%).
The fall in seasonally adjusted services credits of $76m is largely due to a decrease in travel credits. While travel credits remained at a high level in November because of the effect of the Rugby World Cup, the preliminary ABS estimates of the underlying series excluding this effect for November show a return to historical levels from the high levels seen in September and October 2003.
GOODS CREDITS
 SERVICES CREDITS
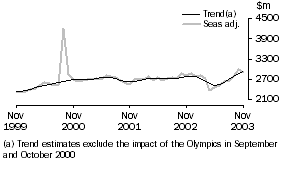
Rural goods
The trend estimate of rural goods rose $18m (1%) to $1,837m.
In seasonally adjusted terms, rural goods decreased $95m (5%) to $1,797m.
Rural goods in original terms, fell $106m (5%) to $1,853m.
Contributing to the fall in the seasonally adjusted series were cereal grains and cereal preparations, down 19% in contrast to the average October to November rise of 1% over the previous three years. This was partly offset by a rise in meat and meat preparations, up 1% in contrast to the average October to November fall of 10% over the previous three years.
Non-rural and other goods
The trend estimate of non-rural and other goods exports fell $26m to $6,872m.
Seasonally adjusted, non-rural and other goods rose $102m (1%) to $6,937m.
In original terms, non-rural and other goods fell $212m (3%) to $6,915m.
Contributing to the rise in the seasonally adjusted series were:
- other non-rural, up $50m (7%) in contrast to the average October to November fall of 20% over the previous three years
- other goods, down $32m (5%) compared to the average October to November fall of 12% over the previous three years
- other mineral fuels, up $47m (7%) compared to the average October to November rise of 3% over the previous three years.
Partly offsetting these effects were:
- other manufactures, down $45m (4%) in contrast to the average October to November rise of 2% over the previous three years
- transport equipment, down $38m (8%) in contrast to the average October to November rise of 2% over the previous three years.
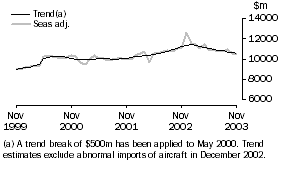
IMPORTS OF GOODS AND SERVICES
The trend estimate of goods and services debits fell $7m in November to $13,493m.
In seasonally adjusted terms, goods and services debits fell $44m to $13,378m.
Goods debits fell $43m, while services debits fell $1m.
GOODS DEBITS
 SERVICES DEBITS
Consumption goods
The trend estimate of imports of consumption goods rose $7m to $3,434.
In seasonally adjusted terms, imports of consumption goods fell $56m (2%) to $3,387m.
Consumption goods, in original terms, decreased $592m (14%) to $3,511m.
Contributing to the fall in the seasonally adjusted series were:
- consumption goods n.e.s., down $194m (15%), compared with an average October to November fall of 6% over the previous three years
- non-industrial transport equipment, down $109m (10%), in contrast to an average October to November rise of 1% over the previous three years
- toys, books and leisure goods, down $119m (27%), compared with an average October to November fall of 13% over the previous three years
- food and beverages, down $79m (16%), compared with an average October to November fall of 4% over the previous three years.
Capital goods
The trend estimate of imports of capital goods fell $10m to $2,533m.
Seasonally adjusted, capital goods imports rose $203m (8%) to $2,606m.
Imports of capital goods, in original terms, decreased $174m (6%) to $2,535m.
Contributing to the rise in the seasonally adjusted series were:
- civil aircraft, rising at a higher rate than their historical average
- industrial transport equipment, with no change, in contrast to an average October to November fall of 6% over the previous three years
- telecommunication equipment, up $12m (3%), compared with an average October to November rise of less than 1% over the previous three years.
Partly offsetting these effects were machinery and industrial equipment and ADP equipment, both down compared with average October to November falls over the previous three years.
Intermediate and other goods
The trend estimate of imports of intermediate and other goods decreased $47m (1%) to $4,627m.
Seasonally adjusted, intermediate and other goods imports fell $190m (4%) to $4,494m.
Imports of intermediate and other goods, in original terms, decreased $909m (17%) to $4,334m.
Contributing to the fall in the seasonally adjusted series were:
- processed industrial supplies, down $162m (15%), in contrast to an average October to November rise of 2% over the previous three years
- organic and inorganic chemicals, down $165m (46%), compared with an average October to November fall of 6% over the previous three years
- other parts for capital equipment, down $123m (15%), compared with an average October to November fall of 8% over the previous three years
- parts for transport equipment, down $91m (15%), compared with an average October to November fall of 5% over the previous three years.
Partly offsetting these effects were:
- goods for processing, up $11m (4%), in contrast to an average October to November fall of 25% over the previous three years
- other merchandise goods, down $2m (2%), compared with an average October to November fall of 27% over the previous three years.
 Print Page
 Print All