 |  | Trend
| Seasonally adjusted
|  |
 |  | Quarterly % change Dec 03 to Mar 04 | Annual % change Mar 03 to Mar 04 | % points contribution to growth in GDP Dec 03 to Mar 04 | Quarterly % change Dec 03 to Mar 04 | Annual % change Mar 03 to Mar 04 | % points contribution to growth in GDP Dec 03 to Mar 04 |  |
|  |
| Compensation of employees | 1.4 | 5.4 | 0.7 | 1.9 | 5.7 | 0.9 |  |
| Gross operating surplus |  |  |  |  |  |  |  |
 | Private | 0.9 | 8.6 | 0.1 | -2.1 | 6.5 | -0.3 |  |
 | Other | 1.7 | 6.5 | 0.3 | 1.4 | 5.8 | 0.2 |  |
| Gross mixed income | 3.6 | 13.5 | 0.3 | 2.8 | 13.9 | 0.2 |  |
| Taxes less subsidies on production and imports | 1.9 | 9.5 | 0.2 | 0.4 | 8.2 | 0.1 |  |
| Statistical discrepancy (I) | . . | . . | 0.3 | . . | . . | 0.2 |  |
| Gross domestic product | 2.0 | 7.8 | 2.0 | 1.3 | 7.2 | 1.3 |  |
|  |
| . . not applicable |
MARCH QUARTER
Summary Comments
Compensation of employees
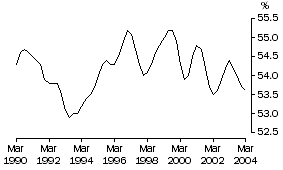
- The trend increase of 1.4% in the March quarter reflects a rise of 0.9% in average earnings and 0.5% rise in the number of wage and salary earners. Seasonally adjusted, compensation of employees grew by 2.0%. Average earnings increased by 0.8%, while the number of wage and salary earners increased by 1.2%. Further discussion of compensation of employees is found on page 13.
Wages Share of Total Factor Income: Trend

Gross operating surplus
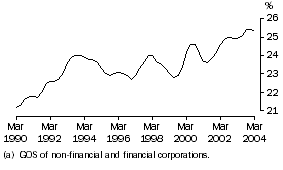
- The trend GOS of financial and non-financial corporations increased by 1.1% in the March quarter, following a rise of 1.8% in the December quarter. In seasonally adjusted terms GOS of financial and non-financial corporations decreased by 1.4% in the March quarter, following a rise of 2.5% in the December quarter.
Profit (a) Share of Total Factor Income: Trend

 Print Page
 Print All