TECHNICAL NOTE DATA QUALITY
ESTIMATION PROCEDURE
1 Estimates of children were derived using a ratio estimation procedure which ensures that estimates conform to an independently estimated state by age by sex distribution of children in the population, rather than to the distribution within the sample itself.
RELIABILITY OF ESTIMATES
2 Since the estimates in this publication are based on information obtained from occupants of a sample of dwellings, they are subject to sampling variability; that is, they may differ from those that would have been produced if all dwellings had been included in the survey. One measure of the likely difference is given by the standard error (SE), which indicates the extent to which an estimate might have varied by chance because only a sample of dwellings was included. There are about two chances in three (67%) that a sample estimate will vary by less than one SE from the number that would have been obtained if all dwellings had been included, and about 19 chances in 20 (95%) that the difference will be less than two SEs. Another measure of the likely difference is the relative standard error (RSE), which is obtained by expressing the SE as a percentage of the estimate.
3 Due to space limitations, it is impractical to include the SE of each estimate in the publication. Instead, a table of SEs is provided to enable readers to determine the approximate SE for an estimate from the size of that estimate (see table T1). The SE table is derived from a mathematical model, referred to as the 'SE model', which is created using the data collected in this survey. It should be noted that the SE model only gives an approximate value for the SE for any particular estimate, since there is some minor variation between SEs for different estimates of the same size.
CALCULATION OF STANDARD ERROR
4 An example of the calculation and the use of SEs in relation to estimates of children is as follows. From table 27 an estimated 892,100 males accessed the Internet in the 12 months ending April 2006. Since this estimate is between 500,000 and 1,000,000, the Australia column of table T1 shows that the SE for this estimate lies between 11,850 and 15,950. The SE can be approximated by interpolation using the following general formula:
SE of estimate
= 
= 11,850 + (((892,100 - 500,000) / (1,000,000 - 500, 000)) x (15,950 - 11,850))
= 15,065
= 15,100 (rounded to the nearest 100)
5 Therefore, there are about 2 chances in 3 that the value that would have been produced if all dwellings had been included in the survey would have been within the range 877,000 and 907,200 and about 19 chances in 20 that the value would have been within the range 861,900 and 922,300. This example is illustrated in the diagram below.
6 In general, the size of the SE increases as the size of the estimate increases. Conversely, the RSE decreases as the size of the estimate increases. Very small estimates are subject to such high RSEs that their value for most practical purposes is unreliable. In the tables in this publication, only estimates with RSEs of less than 25% are considered reliable for most purposes. Estimates with RSEs greater than 25% but less than or equal to 50% are preceded by an asterisk (e.g. *3.4) to indicate they are subject to high RSEs and should be used with caution. Estimates with RSEs of greater than 50%, preceded by a double asterisk (e.g. **0.3), are considered too unreliable for general use and should only be used to aggregate with other estimates to provide derived estimates with RSEs of less than 25%.
MEANS AND MEDIANS
7 This publication contains means and medians. Both are measures for locating the centre of a set of values, but each measure has its own method. The mean is the arithmetic average, whereas the median is the middle value of a set of values when the values are sorted in size order.
8 The RSE of an estimate of a mean or median number of hours or times spent on selected cultural, sporting and other activities can be obtained by firstly finding the RSE of the estimate of the total number of persons contributing to the mean or median (see table T1). This RSE can then be multiplied by the relevant factor below to obtain the RSE of the mean or median:
- mean number of times spent on the selected cultural, sporting or other activity in the past year: 1.33
- median number of times spent on the selected cultural, sporting or other activity in the past year: 1.54
- mean number of hours spent on the selected cultural, sporting or other activity in the last two school weeks: 1.35
- median number of hours spent on the selected cultural, sporting or other activity in the last two school weeks: 2.11
9 The following is an example of the calculation of SEs where the use of a factor is required. Table 22 shows that the estimated number of children who watched television, videos or DVDs during the last two school weeks was 2,596,000, with the median number of hours spent watching television, videos or DVDs being 15 hours. The SE for this estimate of 2,596,000 can be calculated from table T1 (by interpolation) as 23,300. To convert this to a RSE, the SE is expressed as a percentage of the estimate, or 23,300/2,596,000 = 0.9%.
10 The RSE of the estimate of the median number of hours spent watching television, videos or DVDs is calculated by multiplying this number (0.9%) by the appropriate factor shown in paragraph 8 (in this case 2.11): 0.9 x 2.11 = 1.9%. The SE of this estimate of median number of hours spent watching television, videos or DVDs is therefore 1.9% of 15, i.e. about 0.3 hours. Therefore, there are 2 chances in 3 that the median number of hours spent watching television, videos or DVDs that would have been obtained if all children had been included in the survey would have been within the range 14.7 hours to 15.3 hours, and about 19 chances in 20 that it would have been within the range 14.4 hours to 15.6 hours.
PROPORTIONS AND PARTICIPATION RATES
11 Proportions and participation rates formed from the ratio of two estimates are also subject to sampling error. The size of the error depends on the accuracy of both the numerator and the denominator. A formula to approximate the RSE of a proportion is given below. This formula is only valid when x is a subset of y.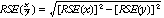
12 Considering the example above, the 892,100 males aged 5-14 years who accessed the Internet in the 12 months ending April 2006, represent 51.5% of the 1,730,700 children in Australia, aged 5-14 years who accessed the Internet. The SE of 1,730,700 may be calculated by interpolation as 19,900. To convert this to a RSE we express the SE as a percentage of the estimate, or 19,900/1,730,700 = 1.1%. The SE for 892,100 was calculated previously as 15,100, which converted to a RSE is 15,100/892,100 = 1.7%. Applying the above formula the RSE of the proportion is 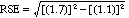 = 1.3%
13 Therefore, the SE for the proportion of Internet users who were male is 0.7 percentage points (=(51.5/100) x 1.3). Therefore, there are about 2 chances in 3 that the proportion of Internet users who were male is between 50.8% and 52.2%, and 19 chances in 20 that the proportion is within the range 50.1% and 52.9%.
DIFFERENCES
14 Published estimates may also be used to calculate the difference between two survey estimates (of numbers or percentages). Such an estimate is subject to sampling error. The sampling error of the difference between two estimates depends on their SEs and the relationship (correlation) between them. An approximate SE of the difference between two estimates (x-y) may be calculated by the following formula: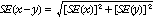
15 While this formula will only be exact for differences between separate and uncorrelated characteristics or subpopulations, it is expected to provide a good approximation for all differences likely to be of interest in this publication.
T1 STANDARD ERRORS OF ESTIMATES |
|  |
| | | | | | | | | AUST. | |
| NSW | Vic. | Qld | SA | WA | Tas. | NT | ACT | SE | RSE | |
| no. | no. | no. | no. | no. | no. | no. | no. | no. | % | |
| |
| 300 | 430 | 360 | 370 | 270 | 300 | 210 | 210 | 220 | 300 | 100.0 | |
| 500 | 550 | 470 | 460 | 340 | 400 | 270 | 270 | 280 | 400 | 80.0 | |
| 700 | 640 | 560 | 540 | 400 | 470 | 320 | 330 | 330 | 480 | 68.6 | |
| 1,000 | 760 | 670 | 640 | 470 | 560 | 370 | 390 | 390 | 580 | 58.0 | |
| 1,500 | 920 | 810 | 760 | 560 | 690 | 450 | 470 | 460 | 720 | 48.0 | |
| 2,000 | 1 050 | 940 | 870 | 640 | 790 | 510 | 540 | 520 | 840 | 42.0 | |
| 2,500 | 1 150 | 1 050 | 950 | 700 | 900 | 550 | 600 | 580 | 950 | 38.0 | |
| 3,000 | 1 250 | 1 150 | 1 050 | 750 | 950 | 600 | 650 | 620 | 1 050 | 35.0 | |
| 3,500 | 1 350 | 1 200 | 1 100 | 800 | 1 050 | 650 | 700 | 650 | 1 100 | 31.4 | |
| 4,000 | 1 450 | 1 300 | 1 200 | 850 | 1 100 | 700 | 750 | 700 | 1 200 | 30.0 | |
| 5,000 | 1 600 | 1 450 | 1 300 | 950 | 1 200 | 750 | 800 | 750 | 1 350 | 27.0 | |
| 7,000 | 1 900 | 1 700 | 1 550 | 1 100 | 1 400 | 850 | 900 | 900 | 1 600 | 22.9 | |
| 10,000 | 2 250 | 2 000 | 1 800 | 1 300 | 1 650 | 950 | 1 050 | 1 000 | 1 900 | 19.0 | |
| 15,000 | 2 700 | 2 350 | 2 200 | 1 550 | 1 950 | 1 100 | 1 200 | 1 200 | 2 350 | 15.7 | |
| 20,000 | 3 050 | 2 700 | 2 500 | 1 750 | 2 200 | 1 200 | 1 300 | 1 350 | 2 700 | 13.5 | |
| 30,000 | 3 700 | 3 200 | 3 000 | 2 050 | 2 650 | 1 350 | 1 500 | 1 550 | 3 250 | 10.8 | |
| 40,000 | 4 200 | 3 600 | 3 450 | 2 300 | 2 950 | 1 450 | 1 650 | 1 750 | 3 750 | 9.4 | |
| 50,000 | 4 650 | 3 950 | 3 800 | 2 550 | 3 250 | 1 550 | . . | 1 900 | 4 150 | 8.3 | |
| 100,000 | 6 350 | 5 200 | 5 250 | 3 400 | 4 200 | 1 850 | . . | . . | 5 750 | 5.8 | |
| 150,000 | 7 600 | 6 100 | 6 300 | 4 000 | 4 900 | . . | . . | . . | 6 950 | 4.6 | |
| 200,000 | 8 650 | 6 800 | 7 200 | 4 500 | 5 450 | . . | . . | . . | 7 900 | 4.0 | |
| 300,000 | 10 350 | 7 900 | 8 700 | . . | 6 300 | . . | . . | . . | 9 450 | 3.2 | |
| 500,000 | 13 000 | 9 500 | 11 050 | . . | . . | . . | . . | . . | 11 850 | 2.4 | |
| 1,000,000 | 17 600 | 12 150 | 15 250 | . . | . . | . . | . . | . . | 15 950 | 1.6 | |
| 2,000,000 | . . | . . | . . | . . | . . | . . | . . | . . | 21 350 | 1.1 | |
| 5,000,000 | . . | . . | . . | . . | . . | . . | . . | . . | 31 000 | 0.6 | |
| |
| . . not applicable |
T2 LEVELS AT WHICH ESTIMATES HAVE RELATIVE STANDARD ERRORS OF 25% AND 50%(a) |
| |
| NSW | Vic. | Qld | SA | WA | Tas. | NT | ACT | Aust. | |
| no. | no. | no. | no. | no. | no. | no. | no. | no. | |
25% RSE | |
| |
| Mean number of times participated in activity | 13 662 | 10 918 | 9 349 | 5 140 | 7 916 | 3 380 | 3 784 | 3 563 | 10 272 | |
| Median number of times participated in activity | 17 937 | 14 211 | 12 271 | 6 672 | 10 297 | 4 318 | 4 856 | 4 590 | 13 749 | |
| Mean number of hours participated in activity | 14 076 | 11 239 | 9 631 | 5 289 | 8 148 | 3 473 | 3 890 | 3 663 | 10 606 | |
| Median number of hours participated in activity | 32 183 | 24 859 | 22 075 | 11 664 | 17 963 | 7 199 | 8 160 | 7 858 | 25 554 | |
| All other estimates | 8 077 | 6 522 | 5 545 | 3 102 | 4 729 | 2 078 | 2 302 | 2 173 | 5 819 | |
50% RSE | |
| |
| Mean number of times participated in activity | 3 760 | 3 036 | 2 610 | 1 483 | 2 194 | 988 | 1 070 | 1 043 | 2 512 | |
| Median number of times participated in activity | 4 954 | 4 008 | 3 422 | 1 936 | 2 902 | 1 299 | 1 420 | 1 362 | 3 407 | |
| Mean number of hours participated in activity | 3 876 | 3 130 | 2 688 | 1 527 | 2 262 | 1 018 | 1 104 | 1 074 | 2 598 | |
| Median number of hours participated in activity | 8 953 | 7 219 | 6 141 | 3 425 | 5 235 | 2 289 | 2 542 | 2 395 | 6 508 | |
| All other estimates | 2 208 | 1 762 | 1 551 | 885 | 1 267 | 571 | 606 | 620 | 1 386 | |
| |
| (a) Refers to the number of persons contributing to the estimate. |
 Print Page
 Print All