Total water consumption by households and industry in 2014-15 was 17,375 gigalitres (GL), a decrease of 6.8 per cent from 18,644 gigalitres in 2013-14. Water consumption by industry decreased by 7.5 per cent, from 16,772 to 15,522 gigalitres, and water consumption by households by 1 per cent, from 1,872 to 1,852 gigalitres.
Total water consumption increased by 23.6 per cent between 2008-09 and 2014-15, with an average increase of 3.9 per cent per year. This change was driven by an increase of 26.8 per cent in consumption by industry since 2008-09, while household consumption increased by only 1.9 per cent over the same period.
During 2014-15, an estimated 76,140 gigalitres of water were extracted from the environment to support the Australian economy — 17.5 per cent lower than 2013-14. Of this amount, 12,060 gigalitres (or 15.8%) were extracted by water providers while the remaining 64,080 gigalitres (or 84.2%) were extracted directly by water users. The Electricity and Gas Supply industry extracted 58,105 gigalitres mainly for hydro-electricity generation — a non-consumptive use.
Total use of reuse water increased by 0.9 per cent from 280 gigalitres in 2013-14 to 283 gigalitres in 2014-15.
Total use of reuse water decreased by 13.5 per cent between 2008-09 and 2014-15, with an average decrease of 2.3 per cent per year.
63,102 gigalitres of water were returned to the environment in 2014-15 as regulated discharge — the majority being used in-stream for hydro-electricity generation — representing a 19.3 per cent decrease from 78,234 gigalitres in 2013-14. This compares to an increase of 31.6 per cent in regulated discharge between 2008-09 and 2014-15.
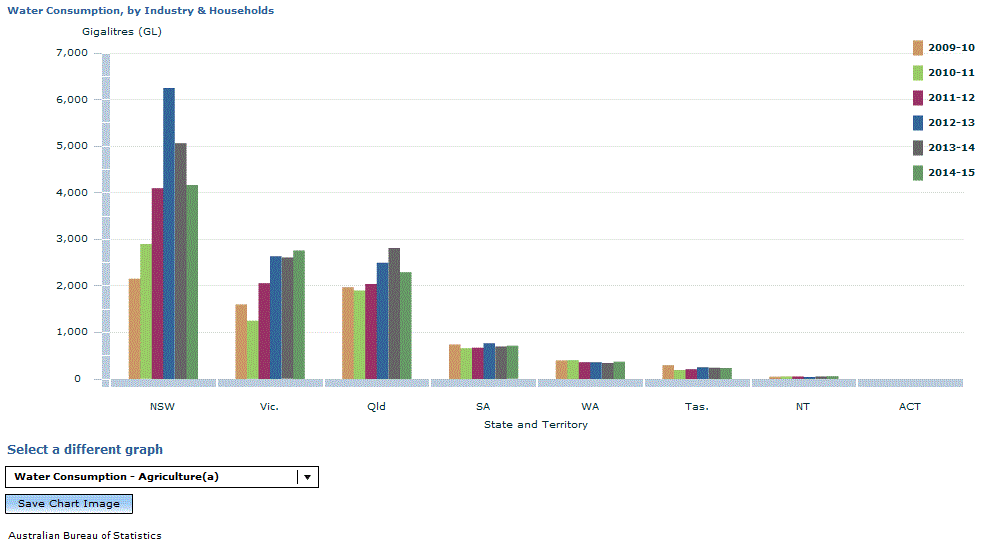
The Agriculture industry consumed the largest volume of water with 10,410 gigalitres, a decrease of 1,178 gigalitres (or 10.2%) from 2013-14. The Agriculture industry accounted for 59.9 per cent of Australia's water consumption in 2014-15, followed by Water Supply, Sewerage and Drainage Services at 2,163 gigalitres, or 12.4 per cent of total consumption (mostly via distribution losses); Households at 1,852 gigalitres (or 10.7%), Mining at 768 gigalitres (or 4.4%) and Manufacturing at 595 gigalitres (or 3.4%).
In percentage terms, the largest downward movements in consumption by the Agriculture industry were recorded in Queensland with a decrease of 511 gigalitres (or 18.5%) and 863 gigalitres (or 17.3%) for New South Wales. The Northern Territory recorded the largest upward movement at 6 gigalitres (or 12.5%) from 2013-14.
Footnote(s): (a) Includes Forestry and Fishing. (b) Includes Sewerage and Drainage Services and Waste Collection, Treatment and Disposal Services. Data includes water losses or water lost in the course of water delivery. (c) Refer to Glossary "Other industries".
Footnote(s): (a) Includes Forestry and Fishing. (b) Includes Sewerage and Drainage Services and Waste Collection, Treatment and Disposal Services. Data includes water losses or water lost in the course of water delivery.;(c) Refer to Glossary "other industries".;
Total revenue from sales of water and related services by the Water Supply, Sewerage and Drainage Services industry was $16.8 billion in 2014-15, an increase of 3.6 per cent from 2013-14 .
Total revenue increased by 45.3 per cent between 2008-09 and 2014-15, relative to the increase of 23.6 per cent in total water consumption over the same period. This change is reflected in the increase of 63.4 per cent in average unit prices between 2008-09 and 2014-15.
Australian industries spent $3 billion on distributed water in 2014-15, an increase of 9.5 per cent from 2013-14, and 38.6 per cent from 2008-09.
Household expenditure on distributed water increased by 0.6 per cent between 2013-14 and 2014-15. Households contributed more than half of all expenditure (63.0%) on distributed water in Australia but household consumption represented 10.7 per cent only of total volumes (excluding distribution losses).
Household expenditure increased by 73.4 per cent between 2008-09 and 2014-15. Households accounted for 57.7 per cent of all expenditure on distributed water in 2008-09 but household consumption represented 12.9 per cent only of total volumes.
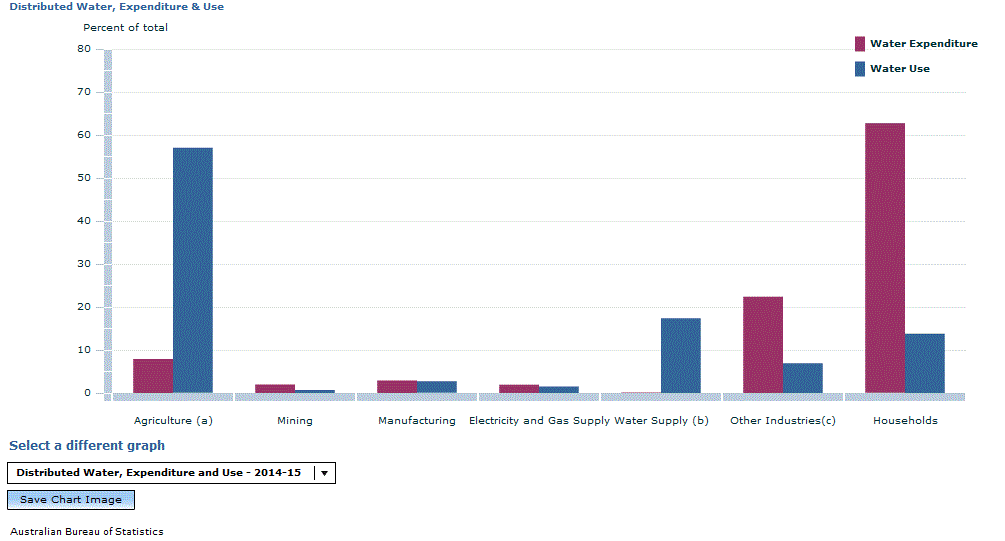
The Agriculture, Forestry and Fishing industry spent $653 million in 2014-15 (3.9% of total expenditure) but used 57 per cent of total distributed water. Expenditure by industries other than Agriculture, Forestry and Fishing in 2014-15 was reported at $2.4 billion for 3,512 gigalitres of distributed water.
The average price of distributed water increased from $0.60 to $0.66 per kilolitre (kL) between 2013-14 and 2014-15 (10%). This was driven by significant increases in the price paid for distributed water by Other industries but offset by decreases in Manufacturing.
The average price paid by the Agriculture, Forestry and Fishing industry for distributed water in 2014-15 was $0.09 per kilolitre, compared to $2.99 per kilolitre paid by households. The corresponding prices in 2008-09 were $0.11 and $1.83 respectively .
South Australian households paid the highest retail unit price in 2014-15 for urban distributed water at $4.46 per kilolitre, followed by households in Queensland ($3.50 per kL), the Australian Capital Territory ($3.16 per kL) and Northern Territory ($3.10 per kL). These prices were above the national average of $2.99 per kilolitre; retail unit prices in the other four states were below the national average price .
The biggest movements in the price of urban distributed water between 2008-09 and 2014-15 were in the Northern Territory (203.9%) and Tasmania (94.4%). The smallest movement was recorded in the Australian Capital Territory (39.2%), while the overall Australian increase was 63.4 per cent.
The retail unit price paid for urban distributed water rose in every jurisdiction except Victoria (-20.9%) between 2013-14 and 2014-15. The Northern Territory recorded the largest increase at 41.6 per cent, followed by New South Wales (8.6%), Queensland (7.4%) and Western Australia (7.1%).
In 2014-15, water intensity (or Gross Value Added per gigalitre of water consumed by industry) was $97 million per gigalitre, up $9 million (or 10.2%) from the previous year. This compares with $106 million in 2008-09, implying that the Australian economy has become less water intensive over this period.
The largest downward movement in water intensity was recorded by Exploration and other mining services (-59.4%).
The largest upward movements in water intensity were recorded below the divisional level by Oil and Gas Extraction (65.7%); Aquaculture, Forestry and Fishing (31.8%); and Non-Metallic Mineral Products Manufacturing (26.0%).
Footnote(s): (a) Includes Forestry and Fishing. (b) Includes Sewerage and Drainage Services and Waste Collection, Treatment and Disposal Services. Data includes water losses or water lost in the course of water delivery. (c) Refer to Glossary "Other industries".
As noted above, a total volume of 76,140 gigalitres were extracted directly from the environment in 2014-15. The industries that extracted the largest volumes of water are Electricity and Gas Supply (76.3% or 58,105 GL), most of which was non-consumptive in-stream use for hydro-electricity generation, and Water Supply, Sewerage and Drainage Services (15.8% or 12,060 GL), most of which was supplied to other users.
In 2014-15, the Water Supply, Sewerage and Drainage Services industry supplied nearly all of distributed water in Australia (99.3% or 12,060 GL); of which 57.5 per cent (or 6,937 GL) was supplied by rural water utilities and service providers, including irrigators.
Surface water was by far the greatest source for water supplied by the Water Supply, Sewerage and Drainage Services industry in 2014-15, with 95.6 per cent of total distributed water (or 11,616 GL). Groundwater provided 385 gigalitres (up 9 GL from 2013-14), while desalination plants supplied 144 gigalitres (18.7% lower than in 2013-14).
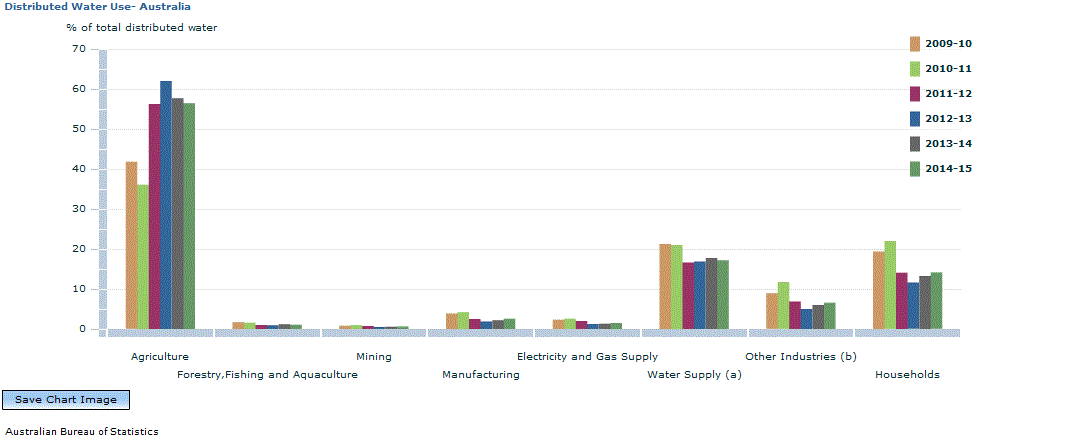
In 2014-15, the Agriculture industry received the largest share of distributed water with 6,852 gigalitres or 56.4 per cent of total distributed water. The Water Supply, Sewerage and Drainage Services industry used 2,089 gigalitres or 17.2 per cent of total distributed use; most of this volume represents through losses to the distribution system. Households used 1,711 gigalitres or 14.1 per cent of total distributed water.
283 gigalitres of reuse water was distributed for consumptive purposes across Australia in 2014-15, increasing by three gigalitres from the previous year.
63,102 gigalitres of regulated water were discharged back to the environment in 2014-15, of which 92.3 per cent (or 58,236 GL) was discharged by the Electricity and Gas Supply industry (almost entirely via hydro-electricity generation).
Regulated discharge by the Water Supply, Sewerage and Drainage Services industry increased by 9.9 per cent between 2013-14 and 2014-15, from 3,013 to 3,311 gigalitres.
Footnote(s): (a) Includes Sewerage and Drainage Services and Waste Collection, Treatment and Disposal Services. Data includes water losses or water lost. (b) Refer to Glossary "Other industries"
The gross value of irrigated agricultural production was $15.1 billion in 2014-15 — an increase of 3.5 per cent from the previous year ($14.6b).
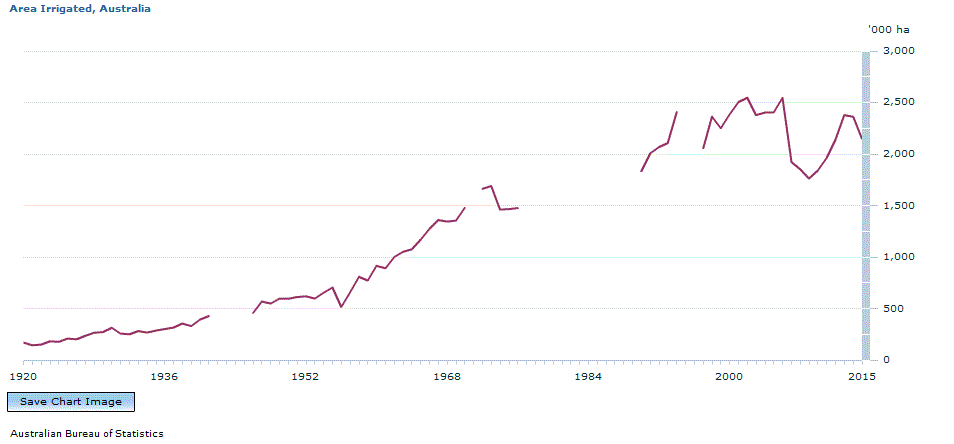
The area of irrigated agricultural land in 2014-15 was 2.1 million hectares, down from 2.4 million hectares in 2013-14 (9.0%). Irrigated land represented 0.6 per cent of all agricultural land in 2014-15.
Water consumption from all agricultural activities reached 11,221 gigalitres in 2014-15 — a decrease of 9.5 per cent from 2013-14 (12,393 GL).
Water consumption by the Agriculture industry (businesses whose primary activity is agriculture) reached 10,410 gigalitres in 2014-15, representing 93 per cent of total agricultural water consumption (11,221 GL).
Use of reuse water by the Agriculture industry decreased by 7.1 per cent from 103 to 95 gigalitres between 2013-14 and 2014-15.
Sheep, Beef Cattle and Grain Farming had the highest water consumption of all Agriculture industry groups in 2014-15 (4,053 GL or 38.9 per cent of the Agriculture industry), followed by Other Crop Growing (2,522 GL or 24.2 per cent), Dairy Cattle Farming (1,879 GL or 18.1%) and Fruit and Tree Nut Growing (1,282 GL or 12.3%).
The largest downward movements in water consumption were Other Crop Growing (29.4% decrease) and Fruit and Tree Nut Growing (6.7% decrease).
The largest upward movements in water consumption were Other Livestock Farming (12.3% increase) and Nursery and Floriculture Production (7.5% increase).
Dairy production consumed the greatest amount of water in 2014-15 for any agricultural activity (1,596 GL or 14.2% of agricultural water use), up five per cent from 1,520 gigalitres in 2013-14. Cotton growing was the second largest consumer of water (1,432 GL or 12.8% of total), decreasing by 53.8 per cent from the previous year (3,099 GL). Rice farming consumed 1,126 gigalitres (or 10.0% of total), increasing by 4.0 per cent from 1,082 gigalitres in 2013-14.
At the state level, cotton production drove significant movements in water consumption by agricultural activity, including New South Wales (52.5% decrease from 2,094 to 994 GL in 2014-15) and Queensland (56.4% decrease from 1,004 GL to 438 GL).
EXPERIMENTAL ESTIMATES OF SOIL WATER (NOT INCLUDED IN THE PHYSICAL SUPPLY AND USE TABLES)
The estimated quantity of water supplied from the soil in Australia for 2014-15 was 329,947 gigalitres, a decrease of 0.3 per cent from 2013-14 at 329,113 gigalitres. Queensland had the largest supply of water from soil of 99,630 gigalitres (or 30.2% of the Australian total).
EXPERIMENTAL ESTIMATES OF CONSUMPTION FROM HOUSEHOLD RAINWATER TANKS (NOT INCLUDED IN THE PHYSICAL SUPPLY AND USE TABLES)
Water consumption from household rainwater tanks in Australia in 2014-15 was estimated to be 171 gigalitres. Areas outside capital cities have the largest consumption at 109 gigalitres (or 63.7% of total consumption). Water consumption from rainwater tanks in 2014-15 was equal to 9.3 per cent of household water consumption (1,852 GL).
Document Selection
These documents will be presented in a new window.
 Quality Declaration
  Print Page
 Print All

.GIF)