 Quality Declaration
Page tools:
 Print Page Print Page
 Print All Print All
| ||||||||||||||||||||||||||||||||||||||||||||||||||||||||||||||||||||||||
PHYSICAL ENERGY SUPPLY OVERVIEW The energy supply tables present data on the supply of energy products for each year from 2002-03 to 2014-15. Net supply consists of energy products as they enter the economy, either by saleable energy products (e.g. mining production) or as imports. The headline measure from the net supply tables is net energy supply, defined as all net energy inputs from domestic sources and imports. Net energy input includes losses from generation, transmission, and other sources and represents all energy entering the economy without any double counting.
Figure 1.3 shows the contribution of selected industries and imports to domestic energy supply in Australia. 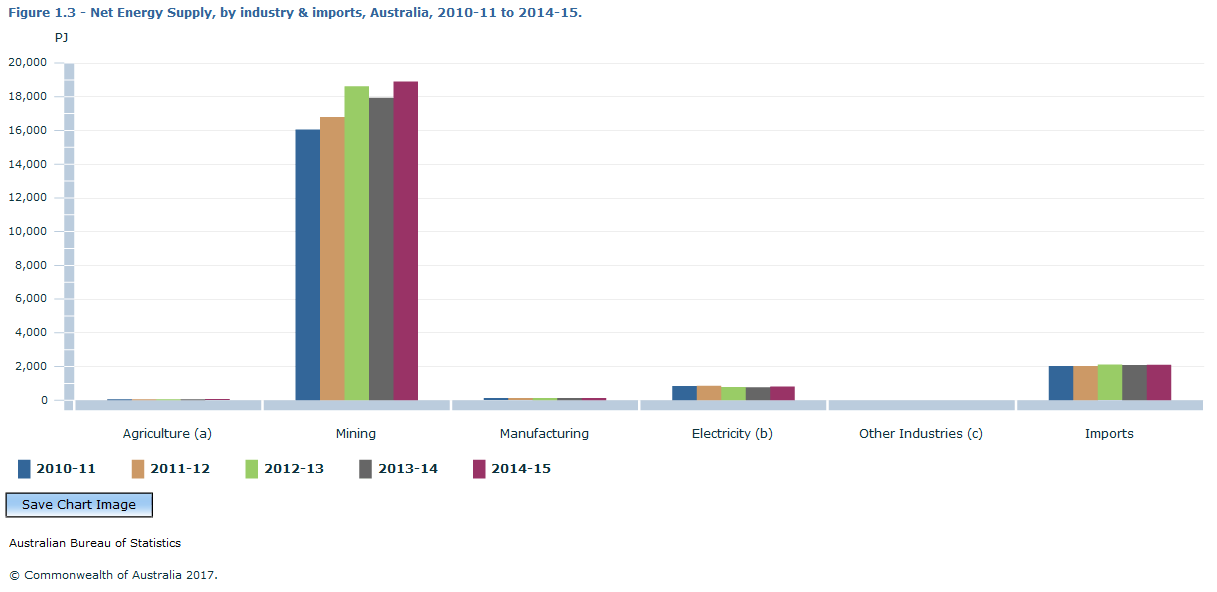 Footnote(s): (a) Includes Forestry and Fishing; (b) Includes Gas, Water supply and Waste services; (c) Includes Construction, Transport and Commercial and services industries. Source(s): Energy Account, Australia The mining industry is the main producer of energy, accounting for 95% (18,906 PJ) of total domestic production (19,921 PJ) in 2014-15. Imports accounted for about 10% of energy supply in Australia in 2014-15. The main imports in 2014-15 were crude oil and refinery feedstock (957 PJ) and diesel (586 PJ). Figure 1.4 shows the contribution of products to domestic energy supply in Australia. 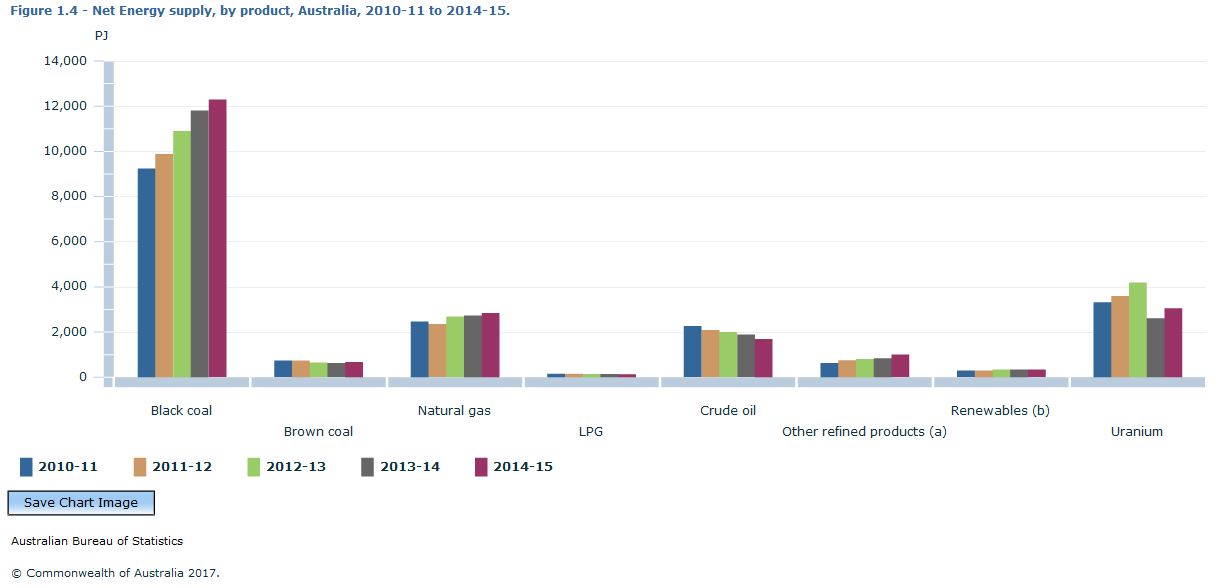 Footnote(s): (a) 'Other refined products' includes petrol, diesel, aviation fuel, kerosene, heating oil, refinery fuel and naptha; (b) 'Renewables' includes biomass wood, bagasse, biofuels, hydro-electricity, solar and wind energy. Source(s): Energy Account, Australia Black coal accounted for 56% (12,288 PJ) of net energy supply in 2014-15, while natural gas was the next largest energy product at 13% (2,846 PJ) of this total. Net supply of the former product increased by 33% (3,044 PJ) between 2010-11 and 2014-15. This increase in production is reflected in exports of black coal, which increased by 38% (3,028 PJ) over the same period. Crude oil is the third largest Australian energy product, accounting for 8% (1,692 PJ) of net energy supply in 2014-15. However, domestic production of crude oil decreased by 28% (280 PJ) between 2010-11 and 2014-15, while imports of the product fell by around 23% (290 PJ) over the same period. Table 1.1 shows the contribution of renewable and non-renewable energy products to domestic energy supply in Australia. In 2014-15, renewable energy extraction accounted for only 2% (337 PJ) of domestic supply. The contributors to this total were bagasse (103 PJ), wood and wood waste (86 PJ), hydro-electricity (48 PJ), wind (41 PJ) and solar (36 PJ). Hydro-electricity supply, which fluctuates according to water availability, decreased by 27% between 2013-14 and 2014-15. Table 1.1 Net energy supply by renewable and non-renewable energy products, Australia, 2014-15
PHYSICAL ENERGY USE OVERVIEW The energy use tables present data on the use of energy products for 2002-03 to 2014-15. Net use consists of intermediate consumption by industry and government; final consumption by households; exports; inventory changes and statistical discrepancy; and conversions and losses. Figure 1.5 shows the contribution by industry and households to domestic energy use in Australia.
Figure 1.5 shows the domestic energy use by industry and households in Australia. 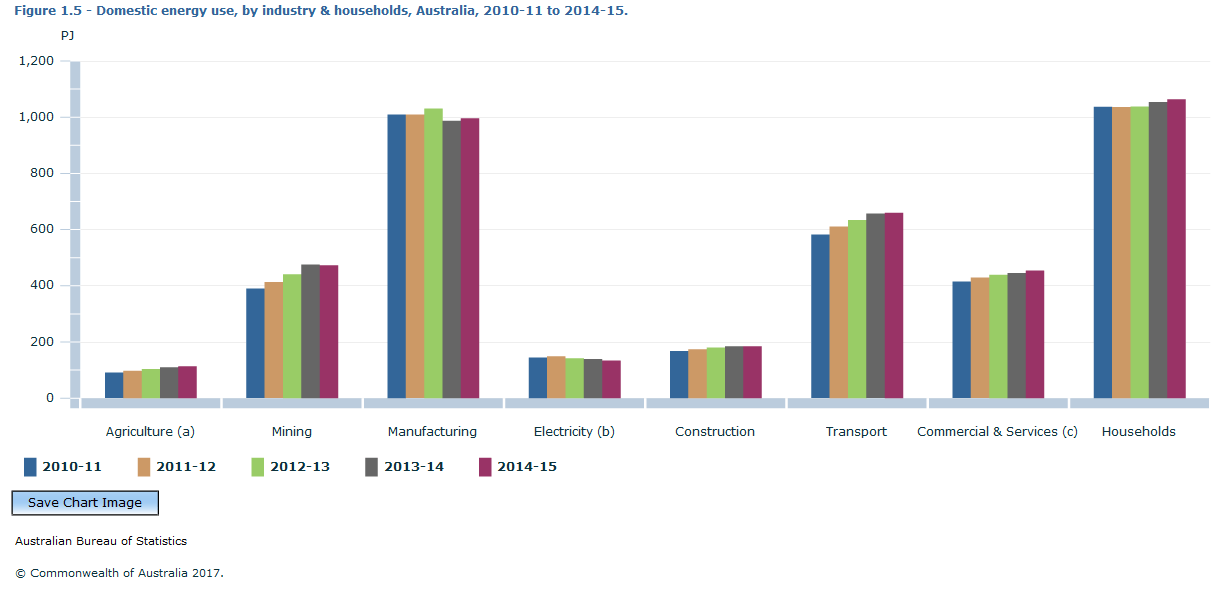 Footnote(s): (a) Includes Forestry and Fishing; (b) Includes Gas, Water Supply and Waste Services; (c) Includes Government use. Source(s): Energy Account, Australia Figure 1.6 shows the contribution of individual products to domestic energy use in Australia. 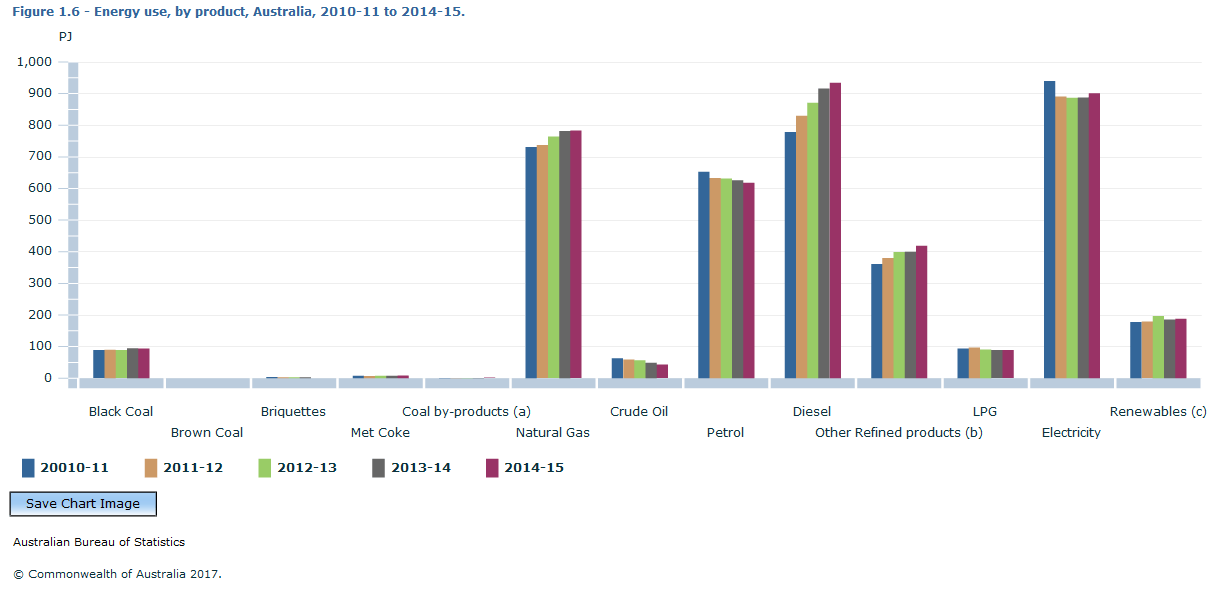 Footnote(s): (a) 'Coal by-produts' include blast furnace gas, coal tar, benzene/toluene/xylene feedstock and coal oven gas; (b) 'Other refined products' includes petrol, diesel, aviation fuel, kerosene, heating oil, refinery fuel and naptha; (c) Renewables' includes biomass wood, bagasse, biofuels, hydro-electricity, solar and wind energy. Source(s): Energy Account, Australia Figure 1.7 shows the contribution of individual products to Australian energy exports. During 2014-15, the export market accounted for 78% (15,725 PJ) of Australian net use of energy. While this share fell between 2013-14 and 2014-15, energy exports remained at relatively the same level. Australia’s main energy exports in 2014-15 were black coal (11,063 PJ), uranium (2,592 PJ) and natural gas (1,365 PJ). 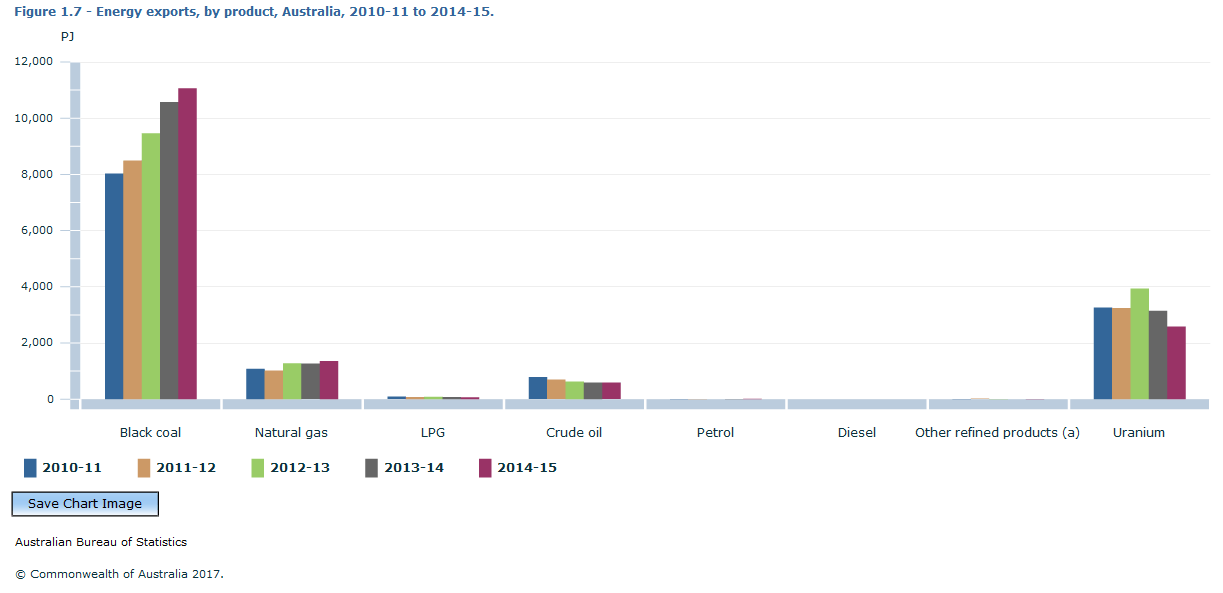 Footnote(s): (a) 'Other refined products' includes aviation fuel, kerosene, heating oil, refinery fuel and naptha. Source(s): Energy Account, Australia Australian households accounted for 26% (1,064 PJ) of total domestic energy consumption. The main energy products consumed by households were petrol (462 PJ), electricity (206 PJ), natural gas (162 PJ) and diesel (125 PJ). Petrol consumption by households has been relatively stable since 2010-11, while diesel consumption increased from 88 PJ to 125 PJ. Between 2010-11 and 2014-15, electricity consumption by households decreased, from 216 PJ to 206 PJ, while household use of natural gas did the opposite, increasing from 148 PJ to 162 PJ. Accounting for 24% (996 PJ) of total domestic energy consumption, the manufacturing industry was the largest industrial consumer of domestic energy in Australia in 2014-15. More than a third of this energy (362 PJ) was consumed in the manufacturing of non-ferrous metals, while petroleum and chemical products and food, beverages and textiles respectively accounted for 22% (222 PJ) and 18% (183 PJ). With 16% (660 PJ) of total domestic energy consumption, the transport industry was the second largest industrial consumer. Nearly one half of this energy (296 PJ) was consumed in the production of air transport, while road transport was responsible for nearly two-fifths (247 PJ) of the industry's energy use. Government energy use accounted for 2% (78 PJ) of total domestic energy use in 2014-15. In this account, government energy use is included within the industry estimates. The main energy products domestically consumed in Australia in 2014-15 were diesel (934 PJ), electricity (901 PJ) and natural gas (783 PJ). Between 2010-11 and 2014-15, the domestic consumption of diesel increased by 20% (155 PJ), while petrol consumption decreased by 5% (35 PJ). The domestic consumption of natural gas also increased by 7% (52 PJ), while domestic consumption of electricity decreased by 4% (39 PJ) over the same period. CONVERSIONS AND LOSSES Conversions and losses occur in the transformation of fossil fuels and organic waste into electricity and biofuels, crude oil into LPG and petroleum products, and coal into coke and coal by-products in steel making. Conversions and losses accounted for 8% (1,853 PJ) of Australian use of energy in 2014-15. Document Selection These documents will be presented in a new window.
|
||||||||||||||||||||||||||||||||||||||||||||||||||||||||||||||||||||||||
